Download
1 / 46
460 likes | 838 Views
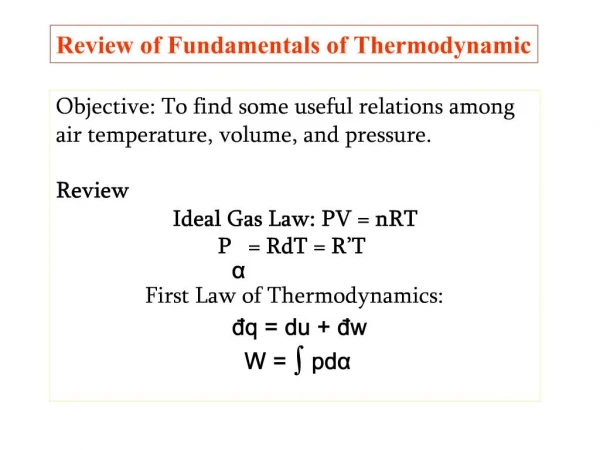
Review (cont.)Definition of heat capacity: cv = du/dT = ?u/?T cp = cv RReformulation of first law for unit mass of an ideal gas:dq = cvdT pdadq = cpdT - adp . Review (cont.)For an isobaric process:dq = cpdTFor an isothermal process:dq = - adp = pda = dwFor an isosteric process:dq = cvdT = duFor an adiabatic process:cvdT = - pda and cpdT = adp.

E N D
2. Review (cont.)
Definition of heat capacity:
cv = du/dT = ?u/?T
cp = cv + R
Reformulation of first law for unit mass of an ideal gas:
dq = cvdT + pda
dq = cpdT - adp
3. Review (cont.)
For an isobaric process:
dq = cpdT
For an isothermal process:
dq = - adp = pda = dw
For an isosteric process:
dq = cvdT = du
For an adiabatic process:
cvdT = - pda and cpdT = adp
4. Review (cont.)
For an adiabatic process:
cvdT = - pda and cpdT = adp
du = dw
(T/T0) = (p/p0)K
Where K = R/cp = 0.286
(T/?) = (p/1000)K
Define potential temperature:
? = T(1000/p)K
Potential temperature, ?, is a conserved quantity in an adiabatic process.
5.
6. Review (cont.)
Remember potential temperature:
? = T(1000/p)K
Potential temperature, ?, is a conserved quantity in a dry adiabatic process.
Equivalent Potential Temperature, ?e, is conserved in both dry and saturated adiabatic ascent or descent. From Wallace and Hobbs (p. 85 ), assuming that ws/T? 0 then ?e? ?.
-Lvws/cpT ? ln(?/?e)
?e ? ? exp(Lvws/cpT)
This is a useful quantity for convective processes.
7. *** THERMODYNAMIC DIAGRAMS ***
8. *** THERMODYNAMIC DIAGRAMS *** Page-2 Contd�
9. *** THERMODYNAMIC DIAGRAMS *** Page-3 Contd�
10. *** THERMODYNAMIC DIAGRAMS ***
11. Isobars and Isotherms The pressure and temperature uniquely define the thermodynamic state of an air parcel (an imaginary balloon) of unit mass at any time.. The horizontal lines represent isobars and the vertical lines describe isotherms.
12. Dry Adiabatic Lines These lines represent the change in temperature that an unsaturated air parcel would undergo if moved up and down in the atmosphere and allowed to expand or become compressed (in a dry adiabatic process) because of the air pressure change in the vertical. Linear wrt Z or ln(p).
13. Pseudo or Wet Adiabatic Lines These curves portray the temperature changes that occur upon a saturated air parcel when vertically displaced. Saturation adiabats appear on the thermodynamic diagram as a set of curves with slopes ranging from 0.2C�/100 m in warm air near the surface to that approaching the dry adiabats (1C�/100 m) in cold air aloft.
14. Isohume � Mixing Ratio Lines These lines (also called saturation mixing ratio lines or isopleths) uniquely define the maximum amount of water vapor that could be held in the atmosphere (saturation mixing ratio) for each combination of temperature and pressure. These lines can be used to determine whether the parcel were saturated or not.
17. Emagram
18. *** SkewT-LogP diagram ***
22. ***Tephigram***
23. The tephigram Allows a radiosonde profile to be analysed for stability.
Allows calculations involving moisture content (e.g., saturated adiabatic lapse rate) to be performed graphically.
Is confusing at first sight!
24. Basic idea Plot temperature as x-axis and entropy as y
df = cpdln? so we plot temperature versus ln?
25. Adding pressure
26. Adding Moisture information Dew point is a measure of moisture content. The tephigram can be used to convert (Td,T) to mixing ratio.
Mass mixing ratio isopleths are light dashed lines. Units are g kg-1
Curved lines are saturated adiabats � the path a saturated parcel of air follows on adiabatic ascent.
27. Rotating plot and plotting profile
28. The Tephigram
30. Tephigram
31. Application of Tephigram to Determine Td
32. Application of Tephigram to Determine different tempertures
33. Example 1
34. Example 2
35. *** St�ve diagram ***
36. Stuve (Pseudoadiabatic)
37. Stuve