Download
1 / 8
90 likes | 235 Views
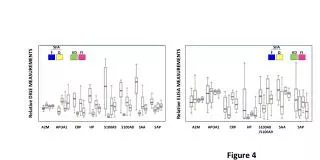
SJIA. SJIA. F. Q. KD. FI. F. Q. KD. FI. Relative DIGE MEASUREMENTS. Relative ELISA MEASUREMENTS. A2M. APOA1. CRP. HP. S100A9. S100A8. SAA. SAP. A2M. APOA1. CRP. HP. S100A8 /S100A9. SAA. SAP. Figure 4. C. A. B. D. Training set n = 24. Testing set n = 20.

E N D
SJIA SJIA F Q KD FI F Q KD FI Relative DIGE MEASUREMENTS Relative ELISA MEASUREMENTS A2M APOA1 CRP HP S100A9 S100A8 SAA SAP A2M APOA1 CRP HP S100A8 /S100A9 SAA SAP Figure 4
C A B D Training set n = 24 Testing set n = 20 Training Testing SJIA • Biomarker panel • of 7 members • A2M • APO AI • CRP • HP • S100A8/S100A9 • SAA • SAP SJIA Clinical diagnosis Clinical diagnosis SJIA F SJIA Q SJIA F SJIA Q F Q F Q 12 12 10 10 n = n = LDA Testing Classified as F Classified as F 11 1 8 3 Predicted probabilities Classified as Q Classified as Q 1 11 2 7 91.6% 91.6% 80% 70% Percent Agreement with clinical diagnosis + - Percent Agreement with clinical diagnosis + - 91.6% 75% Overall P = 1.0 E -4 Overall P = 7 E -2 Patient samples P*= 9.6E -6 P*=4 E -3 Figure 5
E Training Set Testing Set Training + Testing Set Sensitivity Sensitivity Sensitivity ESR : AUC=0.86 ESR : AUC=0.96 ESR : AUC=0.92 S100A8/S100A9 : AUC=0.78 S100A8/S100A9 : AUC=0.73 S100A8/S100A9 : AUC=0.74 CRP : AUC=0.65 CRP : AUC=0.82 CRP : AUC=0.72 panel : AUC=0.82 panel : AUC=0.95 panel : AUC=0.94 1- Specificity 1- Specificity 1- Specificity Figure 5
D B C A Training set n = 23 Testing set n = 15 Training Testing POLY F vs. Q POLY POLY Clinical diagnosis Clinical diagnosis PF PQ PF PQ F Q F Q 13 10 10 5 n = n = Sensitivity LDA Testing Classified as F Classified as F 10 5 3 0 Predicted probabilities Classified as Q Classified as Q 3 5 7 5 76.9% 50% 30% 100% Percent Agreement with clinical diagnosis + - Percent Agreement with clinical diagnosis + - panel : AUC=0.64 65.2% 53.3% CRP : AUC=0.64 Overall P = 0.41 Overall P = 0.20 Patient samples 1- Specificity Supplementary Figure 4
SJIA F KD FI SJIA F Data set n = 34 KD FI 10 12 12 SJIA F NOT-SJIA F Clinical diagnosis 10 24 n = SAP Unsupervised clustering SAA S100A8 S100A9 Clustered as SJIA F 7 1 Clustered as NOT-SJIA F 3 23 HP 70% 95.8% CRP - Percent Agreement with clinical diagnosis + 88.2% APOA1 Overall P = 1.6 E -4 A2M Supplementary Figure 5
A. B KD + FI Training set n = 59 SJIA F KD FI SJIA F KD + FI 22 10 27 SJIA F NOT SJIA F Clinical diagnosis Sensitivity 22 37 n = ESR : AUC=0.661 LDA Predicted probabilities S100A8/S100A9 : AUC=0.543 Classified as SJIA F 16 3 CRP : AUC=0.627 6 34 Classified as NOT SJIA F 72.8% 91.9% panel : AUC=0.801 Percent Agreement with clinical diagnosis + - 84.7% Overall P = 4.3E -7 1- Specificity Patient samples Figure 6
C B A QF QQ SJIA Clinical diagnosis QF QQ 5 10 Sensitivity n = LDA Predicted probabilities Classified as QF 4 0 Classified as QQ 1 10 ESR : AUC=0.68 80% 100% S100A8/S100A9 : AUC=0.74 Percent Agreement with clinical diagnosis + - CRP : AUC=0.82 93.3% panel : AUC=0.90 Overall P = 3.7 E -3 Patient samples 1- Specificity Figure 7