Download

1 / 5
50 likes | 154 Views
Moving Averages are powerful tools in data analysis that help identify trends, especially in cyclical data. By averaging two or more data points, they smooth out fluctuations, making it easier to observe underlying trends. This stage covers the importance of Moving Averages, showcases graphical representations, and explains how they can clarify peaks and troughs in data. Whether you’re analyzing stock prices or any other data set, understanding Moving Averages can enhance your ability to interpret trends effectively.

E N D
Moving Averages OCR Stage 8
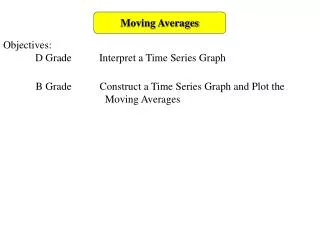
Why use them? • Moving Averages, when graphed, allow us to see any trends in data that are cyclical • By calculating the average of 2 or more items in the data, any peaks and troughs are smoothed out.
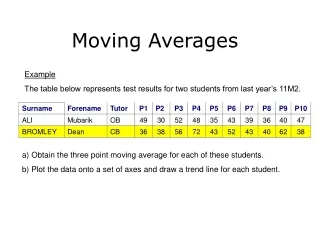
265 269.25 265.25 270.75 4 Period Moving Average
500 x 400 x x 300 x x x x x x x x x x x x x x x 200 x x x 100 1 4 2 3 1 4 2 3 1 4 2 3 1998 1996 1997