Download
1 / 42
460 likes | 718 Views
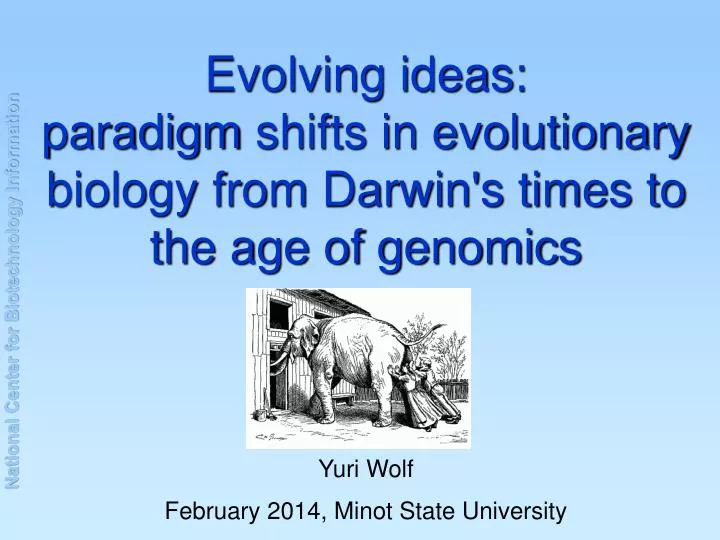
Evolving ideas : paradigm shifts in evolutionary biology from Darwin's times to the age of genomics. Yuri Wolf. February 2014, Minot State University. Overview. Basic Darwinian concepts Synthetic theory of evolution Paradigm shifts (accomplished and emerging): Selection and drift

E N D
Evolving ideas:paradigm shifts in evolutionary biology from Darwin's times to the age of genomics Yuri Wolf February 2014, Minot State University
Overview • Basic Darwinian concepts • Synthetic theory of evolution • Paradigm shifts (accomplished and emerging): • Selection and drift • Darwinian and Lamarckian modes of evolution • Tree of Life and Forest of Life • Genomes and supergenomes • Molecular Clock and Universal Pacemaker
Basic Darwinian Concepts Charles Darwin (1859)
Basic Darwinian Concepts Selection Variation Heredity Encapsulates the conceptual core of evolutionary biology.
Synthetic Theory of Evolution • The following concepts were solidified by synthetic theory of evolution: • discrete genes are the basis of heredity; genomes are collections of genes; progeny inherits parental genomes • random mutations alter genes creating new alleles • different alleles contribute to organism fitness • selection changes allele frequencies in populations • evolution is sufficiently described in terms of changing allele frequencies in populations (including loss and fixation) • evolution is a continuous gradual process over all extant and extinct species that descend from a single Universal Common Ancestor
Synthetic Theory of Evolution Mutation effects are small in magnitude and random in direction; if selection acts "symmetrically" (negative selection), population is at equilibrium; if selection acts "asymmetrically" (positive selection), population experiences changes from generation to generation. parents action of mutation on progeny action of selection on progeny next generation
Selection and Drift Finite populations are subject to stochastic sampling (Wright 1932, 1948). For a long time it was believed that the natural populations are too large to take this into account (Fisher 1930). Elucidation of the role and structure of DNA gradually led to realization that alleles are generated and recombined at the level of single nucleotides (i.e. the number of (semi-) independently inherited units is enormous). Selection under realistic circumstances cannot act on so many units, but mutations keep occurring (Kimura 1968; King and Jukes 1969). A more realistic analysis of population structure and dynamics suggests that effective population sizes are limited in nature, are often in the 104―106 range and probably never exceed 109 (Lynch 2007).
Selection and Drift • Neutrality is the prevalent mode of nucleotide and protein sequence evolution. It has important practical consequences for researchers: • sequence alignments show functionally important regions • sequences carry historical information (Darwin 1959, Ch. X) • Paradigm shift:The neutral nature of observed evolutionary changes becomes the null hypothesis. • Not "What was the reason for this?", but "Was there a reason for this?".
Lamarck, Darwin and Wright Three major conceptual models of evolution: environmental factors mutation-directing mechanism Lamarck beneficial mutations adapted organism environmental factors random mutagenesis selection Darwin beneficial mutations fixed by selection; adapted organism random mutations random mutagenesis random fixation Wright beneficial mutations fixed by chance; adapted organism random mutations
Lamarck, Darwin and Wright Three major conceptual models of evolution: environmental factors radically different modality? mutation-directing mechanism Lamarck beneficial mutations adapted organism environmental factors random mutagenesis selection a continuum, depending on relative strength of drift and selection Darwin beneficial mutations fixed by selection; adapted organism random mutations random mutagenesis random fixation Wright beneficial mutations fixed by chance; adapted organism random mutations
Lamarck, Darwin and Wright CRISPR-Cas system: an almost purely Lamarckian path to adaptation HGT to an organism, entering a particular environment, is enriched with genes, adaptive in this environment
Lamarck, Darwin and Wright Paradigm shift:Lamarckian and Darwinian modalities form a continuum. stochastic drift mutations recombination look-ahead mutations hitchhiking Darwinian modality Lamarckian modality generation of variation fixation of variation epigenetics draft HGT plasmid acquisition selection CRISPR-Cas deterministic Koonin & Wolf 2009, 2010, 2012
Tree of Life Thinking of the history of life in term of phylogenetic trees is as old as scientific biology. Charles Darwin 1859. Origin of Species [one and only illustration]: "descent with modification" Ernst Haeckel 1879 The Evolution of Man
Tree of Life Advent of molecular phylogenetics – expectations of objectively reconstructed complete Tree of Life. Woese 1990.Towards a natural system of organisms: proposal for the domains Archaea, Bacteria, and Eucarya. PNAS 87, 4576-4579 [Figure 1, modified]
Tree of Life in Genomic Era • Genomic era – growing frustration with discrepancies between the trees reconstructed for individual genes and heroic efforts to overcome the noise. Role of horizontal gene transfer in the evolution of prokaryotic genomes is established. • Major lines of approach: • gene repertoire and gene order • distribution of distances between orthologs • concatenated alignments of "non-transferable" gene cores • consensus trees and supertrees Ciccarelli 2006.Towards automatic reconstruction of a highly resolved tree of life. Science 311, 1283-1287 [Figure 2]
Tree of Life, Rejected • Troubled times – "uprooting" of TOL for prokaryotes. • horizontal gene transfer is rampant; no gene is exempt • histories of individual genes are non-coherent with each other • vertical signal is completely lost (or never existed at all) • there are no species (or other taxa) in prokaryotes • a consistent signal we observe is created by biases in HGT "Standard Model" Eukaryotes "Net of Life" Eukaryotes Bacteria Archaea Bacteria Archaea Doolittle 2000.Uprooting the tree of life. Sci. Am. 282, 90-95 [modified]
Forest of Life – Methods • Source data and basic analysis methods: • 100 hand-picked microbial genomes (41 archaea and 59 bacteria) representing a "fair" sample of prokaryote diversity (as known in 2008) • clusters of orthologous genes (NCBI COGs and EMBL EggNOGs) • multiple protein sequence alignments → index orthologs → ML phylogenetic trees • 6901 trees cover 4-100 species; of them 102 cover 90-100 species (Nearly Universal Trees) • direct tree comparison (distances between trees) • quartet decomposition; analysis of quartet spectra • simulation evolutionary models
Forest of Life – Analysis random NUTs NUTs are much closer to each other than expected by chance NUTs form a tightly connected network when clustered by similarity NUTs are connected to the rest of the forest NUTs don’t form clusters (random scatter around center)
Forest of Life – Analysis “Tree-like” vs “Net-like” components of the trees (how many quartets agree/disagree with the consensus tree). NUTs FOL 0.63 +/- 0.35 0.39 +/- 0.31 NUTs are dominated by tree-like descent Overall the forest of life is dominated by network-like relationships (HGT)
Forest of Life – Analysis Simulated example of 16 trees for 10 organisms: No two trees are the same; each contains 2 random deviations from the consensus tree. Common statistical trend is visible.
Forest of Life • Paradigm shift: “Tree of Life” isn’t a useful description of evolutionary history of prokaryotes; “Forest of life” (a.k.a. “phylome”) is a better framework. • Highly conserved nearly universal genes, however, retain the history of tree-like descent of core genes (mostly translation-related). • When necessary, this history can be extracted and used to describe the central statistical trend in nearly universal trees or as the first approximation of the relationships between organisms. • Puigbo 2009, 2010
Genomes and Pangenomes Pangenome – sum total of different genes, sound in a group of organisms. 338 Archaea and Bacteria 41 Archaea Pangenomes, constructed for different groups, display qualitatively similar distributions by the fraction of genomes a gene is common to. 44 Escherichia and Salmonella
Genomes and Pangenomes Pangenome – sum total of different genes, sound in a group of organisms. Cloud: ~24000 genes Core: ~70genes Shell: ~5700 genes 338 Archaea and Bacteria
Genomes and Pangenomes Core, shell and cloud in genomes and pangenomes. individual bacterial genome (genes) core shell prokaryotic pangenome (families) cloud
Genomes in Flux The 109 genomes of for Escherichia, Salmonella,Enterobacterand Citrobacterhave the genome size of 4,700±420 genes and are separated by the evolutionary distance of 0.13 substitutions per site (on the order of 10 million years). There are only 996 (20% of genome) families shared by all of them. 24,110 (x5 genome size) more families are found in two or more isolates, comprising additional 78% of the genome. 9,759 (x2 genome size) genes are found in one genome only (~90 or 2% in each genome). Only 20% of a genome remained intact in 10 million years, many thousands of genes acquired, lost and exchanged.
Genomes and Pangenomes • Pangenomes – theoretical and practical questions: • complete genomes of many groups are sequenced. At this point, sequencing each new isolate usually discovers genes never seen before. Will this trend continue? Or will we, at some point, discover all (most) genes of this group and newly sequenced isolates will consist of different combinations of already known genes? • is there some objective reality behind the concept of pangenome, or it is purely artificial?
Pangenomes and Supergenomes Supergenome – set of genes, compatible with and available to a group of organisms. genomes genomes supergenome pangenome supergenome ancestral genome
Supergenome Size Two common approaches to estimate supergenome size: sampling curves Tettelin 2005 explicit evolutionary modeling Baumdicker 2012
Supergenome Size Our alternative approach (work in progress): gene 1 gene 2 gene 3 number of multiple gains estimates supergenome size gains and losses
Genomes and Supergenomes Paradigm shift: genomes of prokaryotes are in a state of flux, gaining and losing tens of genes per millennium; cores of supergenomes (directly available as pangenomes) are relatively stable and provide a good description of groups of organisms. Wolf & Koonin 2013; Lobkovsky 2013; work in progress
Molecular Clock Divergence between orthologous sequences is proportional to time separating the species. Different genes evolve at specific, roughly constant rates. Zuckerkandl& Pauling 1962 sampling error distance rate divergence time time
Molecular Clock Under MC all individual gene trees are ultrametric (up to a sampling error) and identical to the species tree up to a scaling factor (evolution rate). species tree gene 1 gene 2 A A A B B B C C C D D D E E E F F F G G G H H H time distance distance
Molecular Clock 0.2 Most of the real phylogenetic trees are far from being ultrametric. Molecular clock is substantially overdispersed. observed rate ideal expected based on sampling error time
Relaxed Molecular Clock Relaxed molecular clock models allows for rate variation. Rates are sampled from prior distributions with limited variance, independently or in autocorrelated manner. Genes are either analyzed individually, or as concatenated alignments (implying evolution as a single unit). rate time
Universal Pacemaker Universal Pacemaker model assumes that evolutionary time runs at different pace in each lineage. Under the UPM, species trees are intrinsically non-ultrametric. A A B B C C D D E E F F G G H H time pacemaker ticks
Pacemaker vs Clock Both overdispersed MC and UPM models predict that individual gene trees would deviate from ultrametricity. Under MC these deviations are expected to be uncorrelated. Under UPM these deviations are expected to be correlated, so there exists a non-ultrametric pacemaker tree that can significantly reduce variance of observed rates. A testable hypothesis! 2,300 trees of 100 prokaryotic species; 7,000 trees of 6 Drosophila species 1,000 trees of 9 yeast species 5,700 trees of 8 mammalian species
Pacemaker vs Clock 2,300 trees of 100 prokaryotic species; 7,000 trees of 6 Drosophila species 1,000 trees of 9 yeast species 5,700 trees of 8 mammalian species All show an overwhelming support to UPM model. Snir 2012; work in progress
Pacemaker Properties A B Genes do not cluster in the tree shape space (i.e. no evidence of multiple pacemakers). Variance of observed rate exceeds the sampling and rate estimation variance by a factor of 2 (i.e. half of the observed variance originates from biological, not technical sources).
Universal Pacemaker Paradigm shift: Universal Pacemaker is a more general model, better supported by evidence than Molecular Clock. Pacemaker seems to be Universal in both senses (operates across all genes in a genome and in all organisms). Different lineages evolve at individual rates, possibly faster or slower than related organisms. Lineage-specific evolution rates are probably determined by population dynamics. Individual gene evolution rates deviate from the pacemaker-derived expectation for both technical (sampling fluctuations, calculation errors) and biological reasons. The latter are responsible for ~50% of ovserved rate variation and probably reflect lineage-specific changes of evolutionary pressure on different genes.
In Lieu of Conclusion Evolution theories keep evolving!
Acknowledgments Eugene Koonin, NCBI Pere Puigbo, NCBI Alex Lobkovsky, NCBI David Kristensen, NCBI SagiSnir, University of Haifa, Israel