Download
1 / 2
20 likes | 165 Views
Overview of the GOES-R Proving Ground Activities at the National Hurricane Center. Christopher Velden 1 , Mark DeMaria 2 , John Knaff 2 , Mike Brennan 3 , Jack Beven 3 , Hugh Cob b 3 , Jessica Schauer 3 , Kevin Fuell 4 , Jason Dunion 5 , Michael Folmer 6

E N D
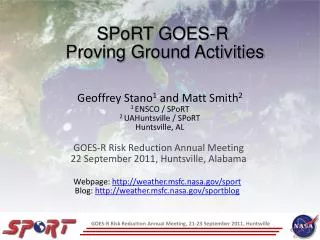
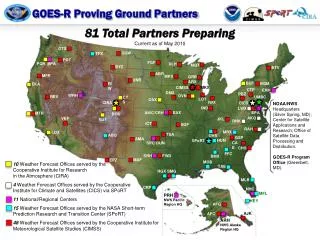
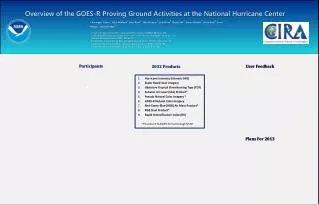
Overview of the GOES-R Proving Ground Activities at the National Hurricane Center Christopher Velden1, Mark DeMaria2, John Knaff2, Mike Brennan3, Jack Beven3, Hugh Cobb3, Jessica Schauer3, Kevin Fuell4, Jason Dunion5, Michael Folmer6 1Cooperative Institute for Meteorological Satellite Studies (CIMSS) Madison, WI 2NOAA/NESDIS Regional and Mesoscale Meteorology Branch (RAMMB), Ft. Collins, CO 3National Hurricane Center (NHC), Miami, FL 4NASA Short-term Prediction Research and Transition Center (SPoRT), Huntsville, AL 5Cooperative Institute for Marine and Atmospheric Studies (CIMAS), Miami, FL 6Cooperative Institute for Climate and Satellites (CICS), College Park, MD Participants Participants User Feedback 2012 Products 2012 Products User Feedback Hurricane Intensity Estimate (HIE) Super Rapid Scan Imagery Objective Tropical Overshooting Tops (TOT) Saharan Air Layer (SAL) Product* Pseudo Natural Color Imagery * GOES-R Natural Color Imagery Red-Green-Blue (RGB) Air Mass Product* RGB Dust Product* Rapid Intensification Index (RII) *Provided in N-AWIPS format through SPoRT Plans For 2013 Plans For 2013
Overview of the GOES-R Proving Ground Activities at the National Hurricane Center Christopher Velden1, Mark DeMaria2, John Knaff2, Mike Brennan3, Jack Beven3, Hugh Cobb3, Jessica Schauer3, Kevin Fuell4, Jason Dunion5, Michael Folmer6 1Cooperative Institute for Meteorological Satellite Studies (CIMSS) Madison, WI 2NOAA/NESDIS Regional and Mesoscale Meteorology Branch (RAMMB), Ft. Collins, CO 3National Hurricane Center (NHC), Miami, FL 4NASA Short-term Prediction Research and Transition Center (SPoRT), Huntsville, AL 5Cooperative Institute for Marine and Atmospheric Studies (CIMAS), Miami, FL 6Cooperative Institute for Climate and Satellites (CICS), College Park, MD 2012 Products 2012 Products Introduction Participants Introduction Participants User Feedback User Feedback Hurricane Intensity Estimate (HIE) Super Rapid Scan Imagery Objective Tropical Overshooting Tops (TOT) Saharan Air Layer (SAL) Product* Pseudo Natural Color Imagery * GOES-R Natural Color Imagery Red-Green-Blue (RGB) Air Mass Product* RGB Dust Product* Rapid Intensification Index (RII) *Provided in N-AWIPS format through SPoRT Plans For 2013 Plans For 2013