Download
1 / 3
30 likes | 34 Views
Price action courses in Hindi and Marathi are provided by Chart Commando, which is one of the few institutions that does so. You can learn how to read the right method from specialists and start making money right away. A course on buying options is also available. Now is the time to go to Chart Commando!

E N D
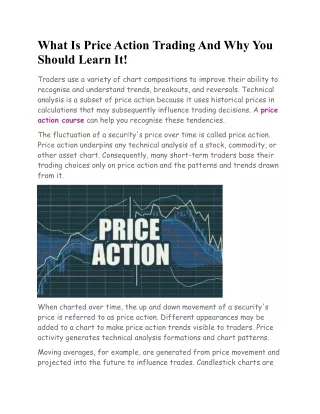
What Is Price Action Trading And Why You Should Learn It! Traders use a variety of chart compositions to improve their ability to recognise and understand trends, breakouts, and reversals. Technical analysis is a subset of price action because it uses historical prices in calculations that may subsequently influence trading decisions. A price action course can help you recognise these tendencies. The fluctuation of a security's price over time is called price action. Price action underpins any technical analysis of a stock, commodity, or other asset chart. Consequently, many short-term traders base their trading choices only on price action and the patterns and trends drawn from it. When charted over time, the up and down movement of a security's price is referred to as price action. Different appearances may be added to a chart to make price action trends visible to traders. Price activity generates technical analysis formations and chart patterns. Moving averages, for example, are generated from price movement and projected into the future to influence trades. Candlestick charts are
popular among traders because they assist to better visualising price movements by presenting the open, high, low, and close values in the context of up or down sessions. Visually interpreted price activity can be seen in candlestick patterns such as the Harami cross, engulfing pattern, and three white soldiers. In addition, many different candlestick patterns are formed due to price activity to set up anticipation of what will happen next. These similar forms may be used in various charts, such as point and figure charts, box charts, and box plots, among others. Price movement is not commonly seen as a trading tool, such as an indicator, but rather as the data source upon which all other instruments are based. Swing and trend traders prefer to work most closely with price movement, ignoring fundamental research favouring focusing only on support and resistance levels to forecast breakouts and consolidation. Even these traders must pay attention to elements other than the current price. For example, the volume of trading and the periods utilised to define levels all affect the possibility of their readings being correct. Price action interpretation is very subjective, however. When two traders analyse the same price movement, it is normal for them to reach different conclusions. For example, one trader may detect a negative downturn, while another believes that the market movement indicates a possible near-term reversal. The critical point to remember is that trading forecasts based on market activity on any period are speculative. The more tools you can use to corroborate your trade prediction, the better. In the end, though, a security's previous price activity is no assurance of future price action.
Chart Commando is one of the few institutions that provide price action courses in Hindi and Marathi. You can learn from experts to interpret the right way and start earning money. An options buying course is also available. Visit Chart Commando now!