Download
1 / 13
130 likes | 241 Views
success. success. error. The control of movement can be studied with the countermanding (stop signal) task. RT distributions of non-cancelled and no stop signal trials. Inhibition function. STOP WINS! cancelled trial. GO WINS! non-cancelled trial. Race model can explain behavior.

E N D
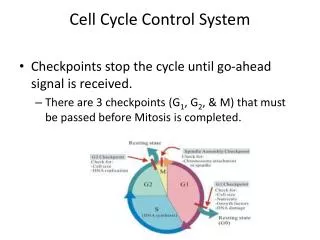
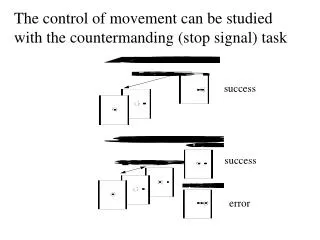
success success error The control of movement can be studied with the countermanding (stop signal) task
RT distributions of non-cancelled and no stop signal trials Inhibition function
STOP WINS! cancelled trial GO WINS! non-cancelled trial Race model can explain behavior Stop Signal Reaction Time (SSRT) – time needed to cancel a previously planned movement
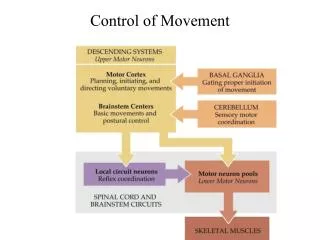
Frontal Eye Field (as part of a network!) Controls when gaze shifts Activation 0.0 0.1 0.2 Time from stimulus (sec) Hanes, D.P. and J.D. Schall (1996) Neural control of voluntary movement initiation. Science 274:427-430.
No Stop Signal Trials Stop Signal SSRT Stop Signal SSRT 200 100 100 Non-canceled Trials 0 400 200 0 0 200 400 No Stop Signal Trials Stop Signal SSRT Stop Signal SSRT 200 Sig. difference before SSRT. 100 100 0 400 200 0 Canceled Trials 0 200 400 Canceled Trials Stop Signal SSRT Stop Signal SSRT 100 100 Sig. difference before SSRT. fixation neurons 50 No Stop Signal Trials 0 0 200 400 400 200 0 No difference. FEF SC movement neurons
GO process STOP process Movement Neuron Fixation Neuron
Mapping the race model onto neural processes 1 - The race model of countermanding performance assumes that the GO and the STOP processes have independent finish times (Logan & Cowan, 1984). 2 – Saccades are produced by a network of interacting neurons. Paradox – How can a network of interacting neurons produce behavior that looks like the outcome of race between independent processes?
Mapping the race model onto neural processes Explore properties of simple network of GO and STOP units. Constrain by the properties of countermanding behavior and by the form of activation of neurons L.Boucher, G.D.Logan, T.J.Palmeri, J.D.Schall. An interactive race model of countermanding saccades. Program No. 72.10. 2003 Abstract Viewer/Itinerary Planner.
ß STOP 1.0 G O pr oc e s s S T O P pr oc e s s G O S T O P 0.5 ß GO s m m s GO, GO STOP, STOP 0.0 0 1 0 0 2 0 0 300 Time from stimulus (ms) GO activation = (GO growth rate – STOP inhibition) + noise STOP activation = (STOP growth rate – GO inhibition) + noise
G O S T O P s m m s GO, GO STOP, STOP Independent Race Model
G O S T O P s m m s GO, GO STOP, STOP Independent Race Model Non-cancelled and no stop signal
ß STOP G O S T O P ß GO s m m s GO, GO STOP, STOP Interactive Race Model
ß STOP G O S T O P ß GO m s m s GO, GO STOP, STOP Interactive Race Model Observed Model Predictions Non-cancelled and no stop signal Cancelled and no stop signal