Download

1 / 17
170 likes | 288 Views
This study presents a novel methodology for clustering large, mixed microarray datasets through the implementation of Chaotic Map Clustering (CMC). By analyzing 587 datasets related to 22,215 genes from the Affymetrix Human Genome U133 Array Set, we demonstrate how CMC uncovers gene expression behavior without prior knowledge of data structure. Our results show CMC's superior efficiency compared to traditional methods, with a peak clustering efficacy of 87%. We also explored cluster validation techniques to confirm the robustness of our findings, revealing new insights into collective cell behaviors.

E N D
GRID distribution supporting chaotic map clustering on large mixed microarray data sets Angelica Tulipano INFN, Section of Bari Andreas Gisel ITB - CNR, Section of Bari
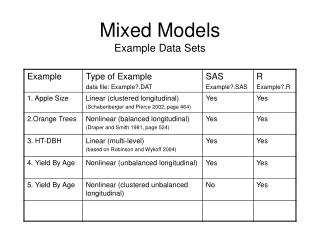
Microarray data • Microarray data contain the expression values of thousands of genes • This allows to detect the collective cell behaviors • Genes with similar temporal and spatial gene expression patterns are believed to be governed by a common regulatory logic • Hundreds of experiments with the same array design are available
comparing expression levels over a wide range of experiments can reveal new and valuable information about behaviours of genes.
Microarray data We selected 587 data sets covering 24 biological experiments from a collection of experiments of the Affimetrix microarray ‘Human Genome U133 Array Set HG-U133A’ related to 22215 genes. Data have been organized in an expression matrix D = ng x ns , where ng (=22215) is the number of genes and ns (=587) is the number of samples (experiments).
Clustering To analyse the data, having no a priori knowledge on their structure, e.g. the number of classes or the geometric distribution, we have chosen an unsupervised hierarchical clustering algorithm based on the cooperative behaviour of an inhomogeneous lattice of coupled chaotic maps, the Chaotic Map Clustering (CMC)[1] [1] L. Angelini, F. De Carlo, C. Marangi, M. Pellicoro and S. Stramaglia, Clustering Data by Inhomogeneous Chaotic Map Lattices, Phys. Rev. Lett., Vol. 85, No. 3, pp 554-557 (2000).
Chaotic Map Clustering CMC does not utilize the distances directly for data partitioning, but it generates "chaotic" trajectories by assigning a dynamical variable (i.e. a chaotic map) to each data point. Pairs of maps are then coupled by means of a decreasing function of the distance of the corresponding data points. The mutual information between pairs of maps, in the stationary regime, is then used as the similarity index for clustering the data set. By setting different threshold values for the mutual information, a hierarchical partition of the data can be obtained as a tree of clusters.
Control of the clustering partition To choose the optimal partition of the data between all the hierarchical levels found by the CMC we used the modularity[2], a measure of the quality of the division in clusters, looking for its peak in the tree of clusters. eij connections between elements of cluster i and cluster j ai = j eij all connections to elements of cluster i for random connection: eij = aiaj MODULARITY: Q = i (eii - ai2) [4] Khan J, et al. Classification and diagnostic prediction of cancers using gene expression profiling and artificial neural networks, Nat. Med. , Vol. 7, No. 6, pp 673-679 (2001)..
Efficiency of CMC Comparison between CMC and Deterministic Annealing (DA). Maximal efficency of • CMC 87% • DA 73%
g1 x s1 g1 x s2 Clustering By genes cluster g11 g1 x s1 Coupled two way clustering By focusing on small subsets, we lowered the noise induced by the other samples and genes experiments cluster s1 cluster s2 cluster g1 genes [8] Getz, G., Levine, E., Domany, E., (2000a) Coupled two-way clustering analysis of gene microarray data. Proc. Natl. Acad. Sci. USA97, 12079-12084
Cluster validation Cluster validation method based on resampling[5]: a cross-validation procedure where subsets of the data under investigation are constructed randomly, and the cluster algorithm is applied to each subset Connectivity matrix for each resampled matrix Tij = Those were compared to the connectivity matrix of the original matrix Starting from the overlap[6] of the original and resampling connectivity matrices we can define “sensitivity”, “positive predictive value” and “specificity”, useful quality measures of a clustering result. [5] Levine E. and Domany E., Resampling method for unsupervised estimation of cluster validity, Neural Comp. , Vol. 13, pp 2573-2593, (2001). [6] Van deer Laan, M.J., Bryan, J., Gene espression analysis with the parametric bootstrap, Biostatistics, Vol. 2, No. 4: pp 445-461, (2001).
Problems of resampling To validate the partition we have obtained by applying CMC to the original matrix 22215x587, we generated 50 randomly resampled matrices 16661x587 PROBLEM - clustering a single matrix of such a size takes about 2 hours; - clustering the whole set of resampled matrices would totally occupy one single CPU for about 4 days.
SE SE Farm3 DB Farm2 RB Farm1 RB RB UI Scheme of the Grid process Grid distribution A job submission tool[7] was used for the submission of a large number of jobs [7] http://webcms.ba.infn.it/cms-software/index.html/index.php/Main/JobSubmissionTool
Results I The entire set of matrices was analysed using 59 worker nodes of the EGEE infrastructure within the Biomed VO The clustering process of a matrix of such size is very intensive, occupying more than 1.5 GB of RAM and this is a requirement which not all the worker nodes have. Some statistics about the distribution • 59 jobs on 59 worker nodes: • 50 succesfull - 4 failed - 5 stopped (64 bit) 3 hours of running (due to queue of the worker nodes)
Results II The average value of the specificity is 0.95 the positive predicted value is 0.65 the sensitivity is 0.81 • these results validate our clusters • but also reflect the complexity of the problem here considered
Conclusion • Using the GRID infrastructure we are able to validate efficiently and accurately large amount of evaluated clusters • We demonstrated that CMC is a potential clustering algorithm for large and heterogeneous microarray data • We demonstrated a application where we clearly differentiated when to use the GRID infrastructure and when to use local resources
Acknowledgements - CNR, IAC Sezione di Bari: Carmela Marangi - CNR, ITB Sezione di Bari: Angelica Tulipano, Giulia De Sario - Dipartimento Interateneo di Fisica, Bari: Leonardo Angelini - INFN, Sezione di Bari: Giacinto Donvito, Giorgio Maggi andreas.gisel@ba.itb.cnr.it
Thank you for your ATTENTION!!