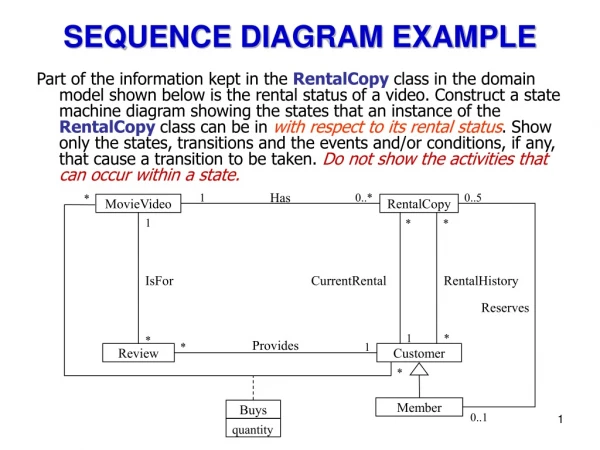
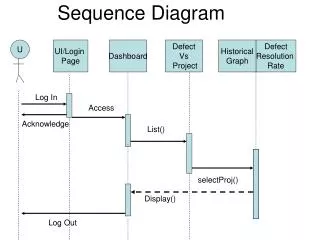
Sequence Diagram
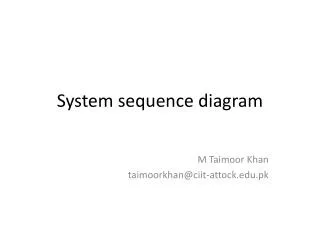
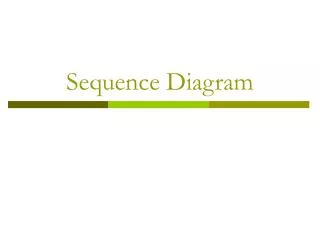
Sequence Diagram. U. UI/Login Page. Dashboard. Defect Vs Project. Historical Graph. Defect Resolution Rate. Log In . Access. Acknowledge. List(). selectProj(). Display(). Log Out. Sequence Diagram.

Sequence Diagram
E N D
Presentation Transcript
Sequence Diagram U UI/Login Page Dashboard Defect Vs Project Historical Graph Defect Resolution Rate Log In Access Acknowledge List() selectProj() Display() Log Out
Sequence Diagram Description: Shows how processes operate with one another and in what order. The parallel, vertical lines show how different objects live simultaneously. The horizontal arrows shows the message exchange between them in order in which they occur and dotted lines extending downwards indicate the timeline. The above diagram shows the following events sequencially. • The user logs in the Dashboard. • Clicks the “List of Project Button” ,the Defect Vs Project Status graph appears. • Upon a project selection ,the he can see the “Historical graph” and “Defect Resolution Graph” displayed on the Dashboard. • User Logs out.