Download
1 / 23
230 likes | 248 Views
This study investigates the comparability of benthic assessments done by the WSA and existing state programs for the assessment of the nation's waters. It analyzes data from cooperating states such as Pennsylvania, Virginia, Tennessee, Missouri, Oklahoma, Iowa, and New England. The study evaluates relationships, effects of natural slope gradient and stressor gradient, and relationships with biological condition gradient. It provides recommendations for improving comparability and standardization of assessments.

E N D
Wadeable Stream Assessment Comparability Study:Interim Results Mark Southerland, Jon Vølstad, Ed Weber, Beth Franks, and Laura Gabanski May 10, 2006
Comparability Studies Associated with National WSA • Comparable state programs can be used to provide a consistent assessment of the Nation’s waters • Side-by-side sampling is being used to determine the comparability of benthic assessments done by WSA and existing state programs
Cooperating States • Pennsylvania • Virginia • Tennessee • Missouri • Oklahoma • Iowa • In 2006, • New England Interstate Water Pollution Control Commission (NEIWPPC), Maryland, Delaware, Wisconsin, and Center for Applied Bioassessment and Biocriteria (Midwest)
Steps • Prepare program summary table • Assemble analysis dataset • Evaluate relationships of IBIs • Evaluate relationships of condition class assessment • Evaluate relationships of pass-fail assessment • Investigate effects of natural slope gradient • Investigate effects of stressor gradient • Investigate relationships with biological condition gradient
Levels of Comparability in Bioassessment • Data comparability - Each program’s data produce same composition of taxa and numbers • Assessment comparability - Stream condition is reported the same by each program • Depends on the indicator • Depends on the condition classes • Depends on scale of assessment
Regressions of WSA and State IBIs – Adjusted-R2 • Pennsylvania 0.47 • Virginia 0.33 • Tennessee 0.47 • Missouri 0.09 • Oklahoma 0.11 • Iowa 0.10
Agreement of Pass-Fail Assessments *Pennsylvania does not have condition classes and was not included in this analysis.
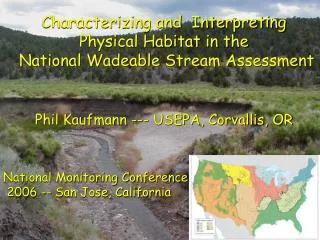
Investigate effects of natural slope gradient • WSA and State methods may be comparable for certain stream types, but not for others • To investigated effects of gradient • Divided into low gradient (≤ 1% slope) and high (not low) gradient > 1% sites
Agreement of Pass-Fail Assessments by Slope No states showed less comparability of low gradient sites than of high gradient sites.
Effects of Stressor Gradient • WSA and State methods may be comparable under certain levels of stress, but not others • Several ways of using non-biological data to describe amount of stress at a site were evaluated • Selected one landscape variable and one composite variable • RHUM300 – human land use in 300m riparian zone • PCA Score – aggregate of site-level water quality and physical habitat conditions
Relationships with Biological Condition Gradient • Assessments depend on the assignment of thresholds of degradation • EPA’s 6-level Biological Condition Gradient (BCG) is an absolute scale for comparing across WSA and states • Three states provided BCG designations (Tennessee, Missouri, Iowa)
See handout Relationships with Biological Condition Gradient
Conclusions & Recommendations • Pass-fail assessment comparability can occur when raw IBI scores are not similar between programs • Evaluation of additional programs from the eight remaining cooperators may or may not lend more support to this conclusion
Conclusions & Recommendations • Differences between the WSA and State IBIs and assessments may be the result of differences in the data collected or the IBIs used • We propose running the State data through the WSA IBIs and the WSA data through the State IBIs • Must reconcile taxonomic levels and laboratory subsampling • Each State should run their own IBI calculations to ensure they accurately reflect their application
Conclusions & Recommendations • There is no standard for how good an agreement is good enough • We propose comparing this between-program agreement with the agreement of samples within the same program • This will require obtaining more replicate samples (only 17 in six-state study)
Conclusions & Recommendations • Study was unbalanced across natural and stressor gradients • Design recommendations: • Retain the paired design for future sampling • Conduct future sampling using a randomized complete block design that allocates an equal number of replicates to each stress category • Improve the method of measuring the stressor gradient if possible