Download

1 / 10
100 likes | 212 Views
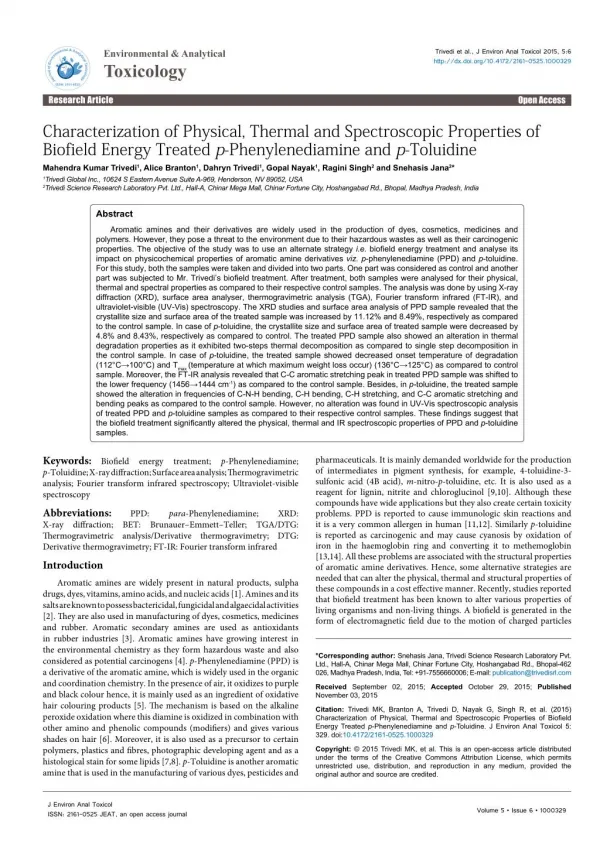
The objective of the study was to use an alternate strategy i.e. biofield energy treatment and analyse its impact on physicochemical properties of aromatic amine derivatives viz. p-phenylenediamine (PPD) and p-toluidine.

E N D
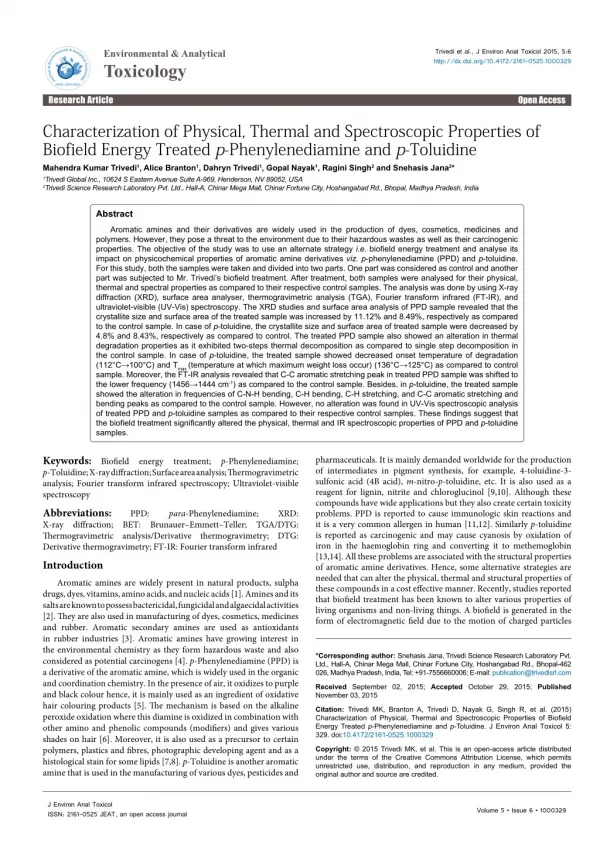
Trivedi et al., J Environ Anal Toxicol 2015, 5:6 http://dx.doi.org/10.4172/2161-0525.1000329 JournalofEnvironmental&AnalyticalToxicology ISSN: 2161-0525 Environmental & Analytical Toxicology Research Article Open Access Research Article Open Access Characterization of Physical, Thermal and Spectroscopic Properties of Biofield Energy Treated p-Phenylenediamine and p-Toluidine Mahendra Kumar Trivedi1, Alice Branton1, Dahryn Trivedi1, Gopal Nayak1, Ragini Singh2 and Snehasis Jana2* 1Trivedi Global Inc., 10624 S Eastern Avenue Suite A-969, Henderson, NV 89052, USA 2Trivedi Science Research Laboratory Pvt. Ltd., Hall-A, Chinar Mega Mall, Chinar Fortune City, Hoshangabad Rd., Bhopal, Madhya Pradesh, India Abstract Aromatic amines and their derivatives are widely used in the production of dyes, cosmetics, medicines and polymers. However, they pose a threat to the environment due to their hazardous wastes as well as their carcinogenic properties. The objective of the study was to use an alternate strategy i.e. biofield energy treatment and analyse its impact on physicochemical properties of aromatic amine derivatives viz.p-phenylenediamine (PPD) and p-toluidine. For this study, both the samples were taken and divided into two parts. One part was considered as control and another part was subjected to Mr. Trivedi’s biofield treatment. After treatment, both samples were analysed for their physical, thermal and spectral properties as compared to their respective control samples. The analysis was done by using X-ray diffraction (XRD), surface area analyser, thermogravimetric analysis (TGA), Fourier transform infrared (FT-IR), and ultraviolet-visible (UV-Vis) spectroscopy. The XRD studies and surface area analysis of PPD sample revealed that the crystallite size and surface area of the treated sample was increased by 11.12% and 8.49%, respectively as compared to the control sample. In case of p-toluidine, the crystallite size and surface area of treated sample were decreased by 4.8% and 8.43%, respectively as compared to control. The treated PPD sample also showed an alteration in thermal degradation properties as it exhibited two-steps thermal decomposition as compared to single step decomposition in the control sample. In case of p-toluidine, the treated sample showed decreased onset temperature of degradation (112°C→100°C) and Tmax (temperature at which maximum weight loss occur) (136°C→125°C) as compared to control sample. Moreover, the FT-IR analysis revealed that C-C aromatic stretching peak in treated PPD sample was shifted to the lower frequency (1456→1444 cm-1) as compared to the control sample. Besides, in p-toluidine, the treated sample showed the alteration in frequencies of C-N-H bending, C-H bending, C-H stretching, and C-C aromatic stretching and bending peaks as compared to the control sample. However, no alteration was found in UV-Vis spectroscopic analysis of treated PPD and p-toluidine samples as compared to their respective control samples. These findings suggest that the biofield treatment significantly altered the physical, thermal and IR spectroscopic properties of PPD and p-toluidine samples. Keywords:Biofield energy treatment; p-Phenylenediamine; p-Toluidine; X-ray diffraction; Surface area analysis; Thermogravimetric analysis; Fourier transform infrared spectroscopy; Ultraviolet-visible spectroscopy Abbreviations: PPD: para-Phenylenediamine; X-ray diffraction; BET: Brunauer–Emmett–Teller; TGA/DTG: Thermogravimetric analysis/Derivative thermogravimetry; DTG: Derivative thermogravimetry; FT-IR: Fourier transform infrared Introduction Aromatic amines are widely present in natural products, sulpha drugs, dyes, vitamins, amino acids, and nucleic acids [1]. Amines and its salts are known to possess bactericidal, fungicidal and algaecidal activities [2]. They are also used in manufacturing of dyes, cosmetics, medicines and rubber. Aromatic secondary amines are used as antioxidants in rubber industries [3]. Aromatic amines have growing interest in the environmental chemistry as they form hazardous waste and also considered as potential carcinogens [4]. p-Phenylenediamine (PPD) is a derivative of the aromatic amine, which is widely used in the organic and coordination chemistry. In the presence of air, it oxidizes to purple and black colour hence, it is mainly used as an ingredient of oxidative hair colouring products [5]. The mechanism is based on the alkaline peroxide oxidation where this diamine is oxidized in combination with other amino and phenolic compounds (modifiers) and gives various shades on hair [6]. Moreover, it is also used as a precursor to certain polymers, plastics and fibres, photographic developing agent and as a histological stain for some lipids [7,8]. p-Toluidine is another aromatic amine that is used in the manufacturing of various dyes, pesticides and pharmaceuticals. It is mainly demanded worldwide for the production of intermediates in pigment synthesis, for example, 4-toluidine-3- sulfonic acid (4B acid), m-nitro-p-toluidine, etc. It is also used as a reagent for lignin, nitrite and chloroglucinol [9,10]. Although these compounds have wide applications but they also create certain toxicity problems. PPD is reported to cause immunologic skin reactions and it is a very common allergen in human [11,12]. Similarly p-toluidine is reported as carcinogenic and may cause cyanosis by oxidation of iron in the haemoglobin ring and converting it to methemoglobin [13,14]. All these problems are associated with the structural properties of aromatic amine derivatives. Hence, some alternative strategies are needed that can alter the physical, thermal and structural properties of these compounds in a cost effective manner. Recently, studies reported that biofield treatment has been known to alter various properties of living organisms and non-living things. A biofield is generated in the form of electromagnetic field due to the motion of charged particles XRD: *Corresponding author: Snehasis Jana, Trivedi Science Research Laboratory Pvt. Ltd., Hall-A, Chinar Mega Mall, Chinar Fortune City, Hoshangabad Rd., Bhopal-462 026, Madhya Pradesh, India, Tel: +91-7556660006; E-mail: publication@trivedisrl.com Received September 02, 2015; Accepted October 29, 2015; Published November 03, 2015 Citation: Trivedi MK, Branton A, Trivedi D, Nayak G, Singh R, et al. (2015) Characterization of Physical, Thermal and Spectroscopic Properties of Biofield Energy Treated p-Phenylenediamine and p-Toluidine. J Environ Anal Toxicol 5: 329. doi:10.4172/2161-0525.1000329 Copyright: © 2015 Trivedi MK, et al. This is an open-access article distributed under the terms of the Creative Commons Attribution License, which permits unrestricted use, distribution, and reproduction in any medium, provided the original author and source are credited. J Environ Anal Toxicol ISSN: 2161-0525 JEAT, an open access journal Volume 5 • Issue 6 • 1000329
Citation: Trivedi MK, Branton A, Trivedi D, Nayak G, Singh R, et al. (2015) Characterization of Physical, Thermal and Spectroscopic Properties of Biofield Energy Treated p-Phenylenediamine and p-Toluidine. J Environ Anal Toxicol 5: 329. doi:10.4172/2161-0525.1000329 Page 2 of 10 such as protons, electrons, and ions in the human body [15]. The energy associated with this field is known as biofield energy and is responsible for communicating information to and among the body. The health of living organisms can be influenced by balancing this energy from the environment through natural exchange process [16]. Biofield therapies are described by National Institute of Health (NIH) and National Centre for Complementary and Alternative Medicine (NCCAM). NCCAM includes biofield therapy as a subcategory of energy medicine among complementary and alternative medicines [17,18]. Almost 43% of the US populations and approximately one- third of the UK populations have been using either form of the healing therapies or the complementary and alternative medicine (CAM) therapy [19]. Thus, the human has the ability to harness the energy from the environment or universe and can transmit it to any living or nonliving object(s) around the Globe. The objects always receive the energy and responding to the useful way. This process is known as biofield energy treatment. Mr. Trivedi’s unique biofield energy (The Trivedi effect®) has been known for its significant impact in the field of material science research [20-22], agriculture research [23,24], microbiology research [25-27] and biotechnology research [28,29]. Hence, based on wide applications of biofield treatment, the current study was designed to evaluate the impact of biofield treatment on physical, thermal and spectroscopic properties of PPD and p-toluidine. Materials and Methods p-Phenylenediamine (PPD) and p-toluidine were procured from Loba Chemie Pvt. Ltd., India. Both samples were divided into two parts; one part was kept as a control while the other part was subjected to Mr. Trivedi’s biofield treatment and coded as treated sample. The treated samples in sealed pack were handed over to Mr. Trivedi for biofield treatment under standard laboratory conditions. Mr. Trivedi provided the treatment through his energy transmission process to the treated groups without touching the samples. The biofield treated samples were returned in the same sealed condition for further characterization using XRD, surface area analyser, TGA, FT-IR and UV-Vis spectroscopic techniques. X-ray diffraction (XRD) study XRD analysis was carried out on Phillips, Holland PW 1710 X-ray diffractometer system. The X-ray generator was equipped with a copper anode with nickel filter operating at 35 kV and 20 mA. The wavelength of radiation used by the XRD system was 1.54056 Å. The XRD data were acquired over the 2θ range of 10°-99.99° at 0.02° interval with a measurement time of 0.5 seconds per 2θ intervals. The data obtained were in the form of a chart of 2θ vs. intensity and a detailed table containing peak intensity counts, d value (Å), peak width (θ°), and relative intensity (%). Where, Gc and Gt are crystallite size of control and treated powder samples respectively. Surface area analysis The surface area of PPD and p-toluidine were measured by the surface area analyser, Smart SORB 90 based on Brunauer–Emmett– Teller (BET). Percent changes in surface area were calculated using following equation: [ Treated S %changeinsurfacearea = ] − Control S × 100 Control S Where, S Control and S Treated are the surface area of control and treated samples respectively. Thermogravimetric analysis/Derivative thermogravimetry (TGA/DTG) Thermal stability of control and treated samples of PPD and p-toluidine was analysed using Mettler Toledo simultaneous thermogravimetric analyser (TGA/DTG). The samples were heated from room temperature to 400ºC with a heating rate of 5ºC/min under air atmosphere.From TGA curve, onset temperature Tonset (temperature at which sample start losing weight) and from DTG curve, Tmax (temperature at which sample lost its maximum weight) were recorded. Spectroscopic studies For determination of FT-IR and UV-Vis spectroscopic characters, the treated samples were divided into two groups i.e. T1 and T2. Both treated groups were analysed for their spectral characteristics using FT-IR and UV-Vis spectroscopy as compared to respective control samples. Fourier transform-infrared characterization The samples were crushed into fine powder for analysis. The powdered sample was mixed in spectroscopic grade KBr in an agate mortar and pressed into pellets with a hydraulic press. FT-IR spectra were recorded on Shimadzu’s Fourier transform infrared spectrometer (Japan). FT-IR spectra are generated by the absorption of electromagnetic radiation in the frequency range 4000-400 cm-1. The FT-IR spectroscopic analysis of PPD and p-toluidine was carried out to evaluate the impact of biofield treatment at atomic and molecular level like bond strength, stability, rigidity of structure, etc. [30]. UV-Vis spectroscopic analysis The UV-Vis spectral analysis was measured using Shimadzu UV- 2400 PC series spectrophotometer over a wavelength range of 200-400 nm with 1 cm quartz cell and a slit width of 2.0 nm. This analysis was performed to evaluate the effect of biofield treatment on the optical properties of PPD and p-toluidine samples. With UV-Vis spectroscopy, it is possible to investigate the electronic transition between orbitals or bands of atoms, ions and molecules existing in the gaseous, liquid and solid phase [31]. Results and Discussion X-ray diffraction X-ray diffraction study was conducted to study the crystalline pattern of the control and treated samples of PPD and p-toluidine (Figure 1). Figures 2 and 3 showed the XRD diffractogram of control (FT-IR) spectroscopic The average size of crystallite (G) was calculated from the Scherrer equation with the method based on the width of the diffraction patterns obtained in the X-ray reflected the crystalline region. G=kλ/(bCosθ) Where, k is the equipment constant (0.94), λ is the X-ray wavelength (0.154 nm), B in radians is the full-width at half of the peaks and θ the corresponding Bragg angle. Percent change in crystallite size was calculated using the following equation: Percent change in crystallite size=[(Gt-Gc)/Gc] × 100 J Environ Anal Toxicol ISSN: 2161-0525 JEAT, an open access journal Volume 5 • Issue 6 • 1000329
Citation: Trivedi MK, Branton A, Trivedi D, Nayak G, Singh R, et al. (2015) Characterization of Physical, Thermal and Spectroscopic Properties of Biofield Energy Treated p-Phenylenediamine and p-Toluidine. J Environ Anal Toxicol 5: 329. doi:10.4172/2161-0525.1000329 Page 3 of 10 that probably strengthen the hydrogen bonding between amino groups of PPD. These intermolecular interactions might lead to the formation of a polymeric chain-like structure that could lead to increasing crystallite size of treated PPD sample as compared to control. Besides, the crystallite size of p-toluidine samples was found as 81.21 and 77.31 nm in control and treated sample, respectively. It suggested that crystallite size was decreased by 4.8% in treated p-toluidine as compared to control (Figure 4). It was previously reported that ultrasonic energy can cause the decrease in crystallite size [33]. Recently, our group reported that biofield treatment has produced lattice strain in ceramic nano oxides [20]. Hence, it is hypothesized that biofield energy treatment might transfer some energy that may create some lattice strain within the molecules geometry. This strain may lead to fracturing of grains into subgrains, which resulted in the decreased crystallite size. Surface area analysis The surface area of control and treated samples of PPD and p-toluidine was investigated using BET method. In PPD, the control sample showed a surface area of 0.377 m2/g; however, the treated sample showed a surface area of 0.409 m2/g. The increase in surface area was 8.49% in the treated PPD sample as compared to control (Figure 4). As it was evident from XRD studies that after biofield treatment, the PPD molecules may form intermolecular chain-like structure [32], hence it could lead to increase the surface area of treated sample as compared to control. In the p-toluidine sample, the control sample showed a surface area of 0.249 m2/g; however, treated sample showed surface area of 0.228 p-Phenylenediamine p-Toluidine Figure 1: Chemical structures of p-phenylenediamine and p-toluidine. p-Phenylenediamine Control Treated p-Toluidine Control Figure 2: X-ray diffractogram (XRD) of control and treated samples of p-phenylenediamine. and treated samples of PPD and p-toluidine, respectively. The XRD diffractograms showed a series of sharp peaks in the regions of 10º<2θ>35º, which depicted that both samples had high crystallinity and long range ordering. From the diffractograms, it was evident that there was no broadening of peaks due to amorphous components, and both samples were found to be crystalline in nature. The average crystallite size was calculated using Scherrer equation. The crystallite size of PPD samples was found as 96.00 and 106.67 nm in control and treated PPD, respectively. It showed that crystallite size was increased by 11.12% in treated PPD as compared to control (Figure 4). It was previously reported that amino groups present in PPD structure have the tendency to interact via N-H⋯N hydrogen bonds into a polymeric chain. These N-H⋯N interactions generate a three- dimensional network of PPD molecules [32]. It is hypothesized that the treated PPD molecules absorbed the energy through biofield treatment Treated Figure 3: X-ray diffractogram (XRD) of control and treated samples of p-toluidine. J Environ Anal Toxicol ISSN: 2161-0525 JEAT, an open access journal Volume 5 • Issue 6 • 1000329
Citation: Trivedi MK, Branton A, Trivedi D, Nayak G, Singh R, et al. (2015) Characterization of Physical, Thermal and Spectroscopic Properties of Biofield Energy Treated p-Phenylenediamine and p-Toluidine. J Environ Anal Toxicol 5: 329. doi:10.4172/2161-0525.1000329 Page 4 of 10 FT-IR spectroscopic analysis Infrared (IR) spectroscopy is based on the vibrations of the atoms in a molecule. When a molecule absorbs infrared radiation, its chemical bonds vibrate and can stretch, contract or bend. FT-IR spectra of control and treated (T1 and T2) samples of PPD and p-toluidine are shown in Figures 7 and 8, respectively. The comparative values of IR peaks of the control sample with treated (T1 and T2) samples are given in Table 1. The major vibration peaks observed were as follows: N-H vibrations: The structure of PPD contains two NH2 groups at the para position. The vibration peaks corresponding to N-H stretching were observed at 3410 and 3375 cm-1 in all three samples i.e. control, T1 and T2. Similarly, the N-H bending peak was observed at 798 cm-1 in all three samples i.e. control, T1, and T2. However,the vibration peak corresponding to C-N-H bending was appeared at 1633 cm-1 in control sample whereas, at 1627 and 1629 cm-1 in T1 and T2 sample, respectively. In case of p-toluidine, the peaks corresponding to N-H stretching were observed at 3419 and 3340 cm-1 in the control sample and 3419 and 3338 cm-1 in treated (T1 and T2) samples. The N-H bending peak was observed at 759 cm-1 in control and T1 samples and 758 cm-1 in T2 sample. Moreover, the vibration peak corresponding to C-N-H bending was appeared at 1616 cm-1 in control sample whereas, in treated samples (T1 and T2) it appeared at 1624 cm-1. Carbon-hydrogen vibrations: The aromatic structures showed the presence of C-H stretching vibrations in the region 3100-3000 cm-1 that were the characteristic region. In PPD samples, the peak of C-H stretching was observed at 3009 cm-1 in all three samples i.e. control, T1, and T2. Similarly, C-H in plane bending peaks was observed at 1130 and 1066 cm-1 in all three samples i.e. control, T1, and T2. The vibration peak due to C-H out of plane bending was observed at 721 cm-1 in control and T2 sample whereas, at 719 cm-1 in T1 sample. The structure of p-toluidine contains two types of C-H bond i.e. aromatic and aliphatic. The aromatic C-H stretching was observed at 3055 and 3024 cm-1 in all three samples i.e. control, T1 and T2. The aliphatic C-H stretching was observed at 2912 and 2860 cm-1 in control and T1 samples and 2908 and 2862 cm-1 in T2 sample. The vibration peaks due to C-H in plane bending were observed at 1178 and 1076 cm-1 in control, 1178 and 1074 cm-1 in T1, and 1178 and 1078 cm-1 in T2 sample. Moreover, C-H out of plane bending peaks were observed at 675 and 640 cm-1 in control sample whereas, at 659 and 640 cm-1 in T1, and 653 and 642 cm-1 in T2 sample. Carbon- carbon vibrations: In PPD sample, the C-C stretching vibrations were observed at 1516 and 1456 cm-1 in control and T1 samples whereas, at 1514 and 1444 cm-1 in T2 sample. However, the peak due to C-C deformation was observed at 515 cm-1 in all three samples i.e. control, T1 and T2. In the p-toluidine sample, the vibration peak due to C-C stretching was observed at 1516 cm-1 in control and T1 sample whereas, at 1521 cm-1 in T2 sample. The peaks due to C-C deformation were appeared at 505 and 462 cm-1 in control and T1 sample but T2 sample, the peaks were observed at 515 and 462 cm-1. C-N vibrations: In PPD sample, the vibration peak belonging to C-N stretching was observed at 1340 cm-1 in control and T1 samples whereas, at 1342 cm-1 in T2 sample. The peak due to C-N-C bending was appeared at 1263 cm-1 in control and T2 samples and at 1265 cm-1 in T1 sample. 15 p-Phenylenediamine p-Toluidine Percent change with 10 respect to control 5 Crystallite size Surface area 0 Crystallite size Surface area -5 -10 Figure 4: Percent change (%) in crystallite size and surface area of treated samples of p-phenylenediamine and p-toluidine as compared to respective control samples. m2/g. The surface area of the treated sample was decreased by 8.43% (Figure 4) as compared to control sample. It was reported previously that pore volume of particles decreased significantly with increasing heat treatment that ultimately decreased the surface area of particles [34]. Hence, it is hypothesized that biofield treatment might transfer the energy that probably reduces the pore volume of treated p-toluidine sample. It further leads to decreased surface area of treated sample as compared to control. TGA/DTG analysis The thermal degradation of PPD and p-toluidine was studied using thermogravimetric techniques. The TGA and DTG thermograms of control PPD sample (Figure 5) showed that decomposition of sample took place in a single step, which started around 141°C (onset) and ended at 216°C. However, the decomposition of treated PPD proceeded in two steps, in which first weight loss was observed around 120-160°C and second decomposition occurred in the temperature range of 170- 220°C. Besides, DTG thermogram data showed that Tmax was found at 186.8°C in control whereas, in treated sample, it was found at 140.72°C in the first step and 192.69°C in the second step. It was assumed in XRD studies that PPD molecules may form a polymer chain like structure due to intermolecular bonding after biofield treatment. Hence from TGA data, it is hypothesized that the first stage degradation of treated PPD sample might occur due to loss of oligomer like structures [35] and second step might be related to thermal decomposition of treated PPD sample. In case of p-toluidine, TGA thermogram (Figure 6) showed that control sample started to decompose at 96°C (onset) and stopped at 166°C (end set). However, the treated p-toluidine started losing weight at 92°C (onset) and terminated at 153°C (end set). It indicated that onset temperature of treated p-toluidine decreased as compared to control. Besides, DTG thermogram data showed that Tmax was found at 136.03°C in control whereas; it was decreased to 125.28°C in treated p-toluidine. It indicated that Tmax was also decreased in treated sample as compared to control. Furthermore, the reduction in Tmax in treated sample of p-toluidine with respect to control sample may be correlated with the increase in thermal decomposition of treated sample of p-toluidine after biofield treatment. The data was also supported by XRD studies, which revealed that crystallite size of treated p-toluidine sample decreased as it was found that there is an inverse relationship between the rate of decomposition and crystallite size [36]. Hence, decrease in crystallite size of treated p-toluidine sample suggested the increase in its thermal decomposition rate. J Environ Anal Toxicol ISSN: 2161-0525 JEAT, an open access journal Volume 5 • Issue 6 • 1000329
Citation: Trivedi MK, Branton A, Trivedi D, Nayak G, Singh R, et al. (2015) Characterization of Physical, Thermal and Spectroscopic Properties of Biofield Energy Treated p-Phenylenediamine and p-Toluidine. J Environ Anal Toxicol 5: 329. doi:10.4172/2161-0525.1000329 Page 5 of 10 p-Phenylenediamine Control Treated Figure 5: TGA/DTG thermogram of control and treated samples of p-phenylenediamine. J Environ Anal Toxicol ISSN: 2161-0525 JEAT, an open access journal Volume 5 • Issue 6 • 1000329
Citation: Trivedi MK, Branton A, Trivedi D, Nayak G, Singh R, et al. (2015) Characterization of Physical, Thermal and Spectroscopic Properties of Biofield Energy Treated p-Phenylenediamine and p-Toluidine. J Environ Anal Toxicol 5: 329. doi:10.4172/2161-0525.1000329 Page 6 of 10 p-Toluidine Control Treated Figure 6: TGA/DTG thermogram of control and treated samples of p-toluidine. J Environ Anal Toxicol ISSN: 2161-0525 JEAT, an open access journal Volume 5 • Issue 6 • 1000329
Citation: Trivedi MK, Branton A, Trivedi D, Nayak G, Singh R, et al. (2015) Characterization of Physical, Thermal and Spectroscopic Properties of Biofield Energy Treated p-Phenylenediamine and p-Toluidine. J Environ Anal Toxicol 5: 329. doi:10.4172/2161-0525.1000329 Page 7 of 10 (p-Phenylenediamine) Control T1 T2 Figure 7: FT-IR spectra of control and treated (T1 and T2) samples of p-phenylenediamine. J Environ Anal Toxicol ISSN: 2161-0525 JEAT, an open access journal Volume 5 • Issue 6 • 1000329
Citation: Trivedi MK, Branton A, Trivedi D, Nayak G, Singh R, et al. (2015) Characterization of Physical, Thermal and Spectroscopic Properties of Biofield Energy Treated p-Phenylenediamine and p-Toluidine. J Environ Anal Toxicol 5: 329. doi:10.4172/2161-0525.1000329 Page 8 of 10 Control p-Toluidine T1 T2 Figure 8: FT-IR spectra of control and treated (T1 and T2) samples of p-toluidine. J Environ Anal Toxicol ISSN: 2161-0525 JEAT, an open access journal Volume 5 • Issue 6 • 1000329
Citation: Trivedi MK, Branton A, Trivedi D, Nayak G, Singh R, et al. (2015) Characterization of Physical, Thermal and Spectroscopic Properties of Biofield Energy Treated p-Phenylenediamine and p-Toluidine. J Environ Anal Toxicol 5: 329. doi:10.4172/2161-0525.1000329 Page 9 of 10 Wavenumber (cm-1) p-phenylenediamine Control 3410 3375 S No Functional group p-toluidine Control 3419 3340 T1 3410 3375 T2 3410 3375 T1 3419 3338 T2 3419 3338 1 N-H stretching 2 C-H stretching (aromatic) 3009 3009 3009 3055 3024 3055 3024 3055 3024 3 C-H stretching - - - 2912 2860 2912 2860 2908 2862 4 C-N-H bending 1633 1627 1629 1616 1624 1624 5 C-C stretching (aromatic) 1516 1456 1516 1456 1514 1444 1516 1516 1521 6 C-N stretching 1340 1340 1342 1338 1338 1340 7 C-N-C bending 1263 1265 1263 1269 1269 1271 8 C-H deformation (in plane) 1130 1066 1130 1066 1130 1066 1178 1076 1178 1074 1178 1078 9 Disubstituted ring 831 831 831 813 813 821 10 N-H bending 798 798 798 759 759 758 11 C-H bending (out of plane) 721 719 721 675 640 659 640 653 642 12 C-C deformation 515 515 515 505 462 505 462 515 462 Table 1: Vibration modes observed in p-phenylenediamine and p-toluidine. In the p-toluidine sample, the peak corresponding to C-N stretching was observed at 1338 cm-1 in control and T1 sample and 1340 cm-1 in T2 sample. Similarly, the peak corresponding to C-N-C bending was appeared at 1269 cm-1 in control and T1 samples and at 1271 cm-1 in T2 sample. Ring vibration: The peak due to disubstituted benzene in PPD was appeared at 831 cm-1 in all three samples i.e. control, T1 and T2. However, in the p-toluidine sample, the peak was observed at 813 cm-1 in control and T1 samples but at 821 cm-1 in T2 sample. The FT-IR spectra of the control sample of PPD and p-toluidine are well supported by literature [37,38]. The FT-IR spectra of treated PPD samples (T1 and T2) showed similar pattern of IR absorption peaks as control sample except C-C aromatic stretching peak in T2 sample which was shifted to lower frequency (1456→1444 cm-1) as compared to control sample.It is already reported that the peak frequency (ν) in IR spectra for any bond is directly proportional to its bond force constant (k). Also, the bond force constant (k) is inversely related to average bond length (r) [22]. Hence, it is presumed that shifting of peak wavenumber corresponding to aromatic C-C bond could be due to change in corresponding bond length after biofield treatment. The FT-IR spectra of treated p-toluidine (T1 and T2) samples showed similar peaks like in control sample except the peaks corresponding to C-N-H bending and C-H bending in both treated samples (T1 and T2); and vibration peaks due to C-H stretching, disubstituted ring, C-C aromatic stretching and bending in T2 sample (Table 1). The peaks corresponding to C-N-H bending peak was shifted towards higher frequency in both treated samples (1616 cm-1→1624 cm-1) and C-H bending peak was shifted towards lower frequency (675→659 cm-1 in T1 and 675→653 cm-1 in T2) as compared to control. Similarly, the C-H stretching peak was shifted towards lower frequency (2912→2908), and disubstituted ring (813→821), C-C aromatic stretching (1516→1521 cm-1) and C-C bending (505→515 cm-1) peaks were shifted towards higher frequency in T2 sample. These results suggest that biofield treatment might induce some changes in bond length and bond angle corresponding to these bonds in treated samples as compared to control. UV-Vis spectroscopic analysis: In UV spectra of control PPD sample, the absorption peaks were observed at 205, 242 and 308 nm. The treated samples (T1 and T2) showed similar peaks i.e. at 204, 243 and 308 nm in T1 sample and at 204, 242 and 308 nm in T2 sample. Similarly, the control sample of p-toluidine showed absorption peaks at 204, 234 and 290 nm. The treated samples showed similar peaks i.e. at 204, 235 and 290 nm in T1 sample and 202, 234 and 289 nm in T2 sample. The UV-Vis spectral data suggested that biofield treatment might not cause any significant change in treated PPD and p-toluidine samples in terms of structure or position of functional groups as well as the energy which is responsible for electron transfer between orbitals or bands of atoms, ions and molecules. Conclusion The XRD results showed 11.12% increase in crystallite size in the biofield treated PPD, which suggests that biofield treatment may induce the intermolecular interactions in the treated PPD sample. However, the crystallite size of treated p-toluidine sample was decreased by 4.8% as compared to the control sample which may be a result of the fracturing of grains into subgrains caused by lattice strain produced via biofield energy. Thermal analysis data revealed that thermal decomposition of biofield treated PPD sample took place in two steps as compared to single step in the control sample. In treated p-toluidine sample, the onset temperature and Tmax was reduced as compared to the control sample. On the basis of reduction in these values, it is hypothesized that thermal decomposition of treated p-toluidine sample increased. The FT-IR analysis revealed that vibration peak corresponding to C-C aromatic stretching in treated PPD sample shifted to lower frequency. Moreover, in treated p-toluidine samples, the frequency of peaks corresponding to C-N-H bending, C-H bending, C-H stretching, disubstituted ring, and C-C aromatic stretching and bending were altered as compared to the control sample. These alterations suggest that biofield treatment might induce some changes at bonding level, which ultimately results in the change in frequencies of corresponding peaks. The overall results suggest that the biofield treatment affected the physical, thermal and spectroscopic properties of PPD and p-toluidine samples. However, further studies are needed to elucidate the impact of these findings on the uses and hazards associated with these compounds. Acknowledgements The authors would like to acknowledge the whole team from the Sophisticated Analytical Instrument Facility (SAIF), Nagpur, Indian Rubber Manufacturers Research Association (IRMRA), Thane and MGV Pharmacy College, Nashik for providing the instrumental facility. Authors are very grateful for the support of Trivedi Science, Trivedi Master Wellness and Trivedi Testimonials in this research work. J Environ Anal Toxicol ISSN: 2161-0525 JEAT, an open access journal Volume 5 • Issue 6 • 1000329
Citation: Trivedi MK, Branton A, Trivedi D, Nayak G, Singh R, et al. (2015) Characterization of Physical, Thermal and Spectroscopic Properties of Biofield Energy Treated p-Phenylenediamine and p-Toluidine. J Environ Anal Toxicol 5: 329. doi:10.4172/2161-0525.1000329 Page 10 of 10 References 23. Sances F, Flora E, Patil S, Spence A, Shinde V (2013) Impact of biofield treatment on ginseng and organic blueberry yield. Agrivita J Agric Sci 35: 22- 29. 1. Berry DF, Boyd SA (1984) Oxidative coupling of phenols and anilines by peroxidase: Structure-activity relationships. Soil Sci Soc Am J 48: 565-569. 24. Lenssen AW (2013) Biofield and fungicide seed treatment influences on soybean productivity, seed quality and weed community. Agricultural Journal 83: 138-143. 2. Kareem MT, Ibrahim KA (2011) Synthesis and characterization of some anilines oxidative coupling products. TJPS 16: 42-49. 3. Kasthuri J, Santhanalakshmi J, Rajendiran N (2008) Antipyrilquinoneimine dye formation by coupling aniline derivatives with 4-aminoantipyrine in the presence of ruthenium nanoparticles. J Iran Chem Soc 5: 436-444. 25. Trivedi MK, Patil S, Shettigar H, Bairwa K, Jana S (2015) Phenotypic and biotypic characterization of Klebsiella oxytoca: An impact of biofield treatment. J Microb Biochem Technol 7: 203-206. 4. Islor AM, Chandrakantha B, Gerber T, Hosten E, Betz R (2013) Redetermination of the structure of 4-amino-benzonitrile, C7H6N2. Z Krist-New Cryst St 228: 217-218. 26. Trivedi MK, Patil S, Shettigar H, Gangwar M, Jana S (2015) An effect of biofield treatment on multidrug-resistant Burkholderia cepacia: A multihost pathogen. J Trop Dis 3: 167. 5. Budavari S (1989) The Merck Index-Encyclopedia of Chemicals, Drugs and Biologicals. Merck and Co. Inc., Rahway, NJ. 27. Trivedi MK, Patil S, Shettigar H, Gangwar M, Jana S (2015) Antimicrobial sensitivity pattern of Pseudomonas fluorescens after biofield treatment. J Infect Dis Ther 3: 222. 6. Dolinsky M, Wilson CH, Wisneski HH, Demers FX (1968) Oxidation products of p-phenylenediamine in hair dyes. J Soc Cosmet Chem 19: 411-422. 28. Patil SA, Nayak GB, Barve SS, Tembe RP, Khan RR (2012) Impact of biofield treatment on growth and anatomical characteristics of Pogostemon cablin (Benth). Biotechnology 11: 154-162. 7. Smiley RA (2000) Phenylene- and toluenediamines. Ullmann’s Encyclopedia of Industrial Chemistry. John Wiley and Sons. 29. Nayak G, Altekar N (2015) Effect of biofield treatment on plant growth and adaptation. J Environ Health Sci 1: 1-9. 8. Engels HW, Weidenhaupt HJ, Pieroth M, Hofmann W, Menting KH, et al. (2004) Ullmann’s Encyclopedia of Industrial Chemistry. John Wiley and Sons. 30. Pavia DL, Lampman GM, Kriz GS (2001) Introduction to spectroscopy. 3rd (Edn) Thomson Learning, Singapore. 9. O'Neil MJ (2006) The Merck Index-An encyclopedia of chemicals, drugs, and biologicals. Merck and Co. Inc., Whitehouse Station, NJ, USA. 31. Chabukswar V, Bhavsar S, Horne A (2011) Organic synthesis and characterization of electrically conducting poly (o-toluidine) doped with organic acid. Chemistry & Chemical Technology 5: 37-40. 10. https://www.spectrumchemical.com/MSDS/T3731.PDF 11. Ahmed HAM, Maaboud RMA, Latif FFA, El-Dean AMK, El-Shaieb KM, et al. (2013) Different analytical methods of para-phenylenediamine based hair dye. JCDSA 3: 17-25. 32. Czapik A, Konowalska H, Gdaniec M (2010) p-Phenylenediamine and its dihydrate: two-dimensional isomorphism and mechanism of the dehydration process, and N-H...N and N-H...pi interactions. Acta Crystallogr C 66: o128- 132. 12. Jenkinson C, Jenkins RE, Aleksic M, Pirmohamed M, Naisbitt DJ, et al. (2010) Characterization of p-phenylenediamine-albumin binding sites and T-cell responses to hapten-modified protein. J Invest Dermatol 130: 732-742. 33. Sumari S, Roesyadi A, Sumarno S (2013) Effects of ultrasound on the morphology, particle size, crystallinity, and crystallite size of cellulose. Sci Study Res Chem Chem Eng Biotechnol Food Ind 14: 229-239. 13. Sekimpi DK, Jones RD (1986) Notifications of industrial chemical cyanosis poisoning in the United Kingdom 1961-80. Br J Ind Med 43: 272-279. 34. Behnajady MA, Aalamdari ME, Modirshahla N (2013) Investigation of the effect of heat treatment process on characteristics and photocatalytic activity of TiO2- UV100 nanoparticles. Environ Prot Eng 39: 33-46. 14. Pullman A, Ts’o POP, Gelboin H (1980) Carcinogenesis: Fundamental mechanisms and environmental effects. D. Reidel Publishing Company, Holland. 35. Sri A, Shanti RJ (2014) Synthesis and characterization of poly (p-phenylenediamine) in the presence of sodium dodecyl sulfate. Res J Chem Sci 4: 60-67. 15. Neuman MR (2000) Biopotential electrodes. The biomedical engg handbook. (2nd edn), Boca Raton, CRC Press LLC. 16. Rubik B (2002) The biofield hypothesis: its biophysical basis and role in medicine. J Altern Complement Med 8: 703-717. 36. Stern KH (2000) High temperature properties and thermal decomposition of inorganic salts with oxyanions. CRC press, Florida, USA. 17. Thomas AH (2012) Hidden in plain sight: The simple link between relativity and quantum mechanics. Swansea, UK. 37. Savitskii AV, Kuznetsov LM (1971) Infrared spectrum of paraphenylenediamine dihydrochloride. J Struct Chem 12: 1016-1018. 18. NIH, National Center for Complementary and Alternative Medicine. CAM Basics. Publication 347. 38. Sharma R, Paliwal M, Singh S, Ameta R, Ameta SC (2008) Synthesis, characterization and electrical conductivity of charge transfer complex of p-toluidine and chloranil. Indian J Chem Techn 15: 613-616. 19. Movaffaghi Z, Farsi M (2009) Biofield therapies: biophysical basis and biological regulations? Complement Ther Clin Pract 15: 35-37. 20. Trivedi MK, Nayak G, Patil S, Tallapragada RM, Latiyal O (2015) Studies of the atomic and crystalline characteristics of ceramic oxide nano powders after bio field treatment. Ind Eng Manage 4: 161. 21. Trivedi MK, Patil S, Nayak G, Jana S, Latiyal O (2015) Influence of biofield treatment on physical, structural and spectral properties of boron nitride. J Material Sci Eng 4: 181. OMICS International: Publication Benefits & Features 22. Trivedi MK, Patil S, Shettigar H, Singh R, Jana S (2015) An impact of biofield treatment on spectroscopic characterization of pharmaceutical compounds. Mod Chem appl 3: 159. Unique features: • • • Increased global visibility of articles through worldwide distribution and indexing Showcasing recent research output in a timely and updated manner Special issues on the current trends of scientific research Special features: • 700 Open Access Journals • 50,000 Editorial team • Rapid review process • Quality and quick editorial, review and publication processing • Indexing at PubMed (partial), Scopus, EBSCO, Index Copernicus, Google Scholar etc. • Sharing Option: Social Networking Enabled • Authors, Reviewers and Editors rewarded with online Scientific Credits • Better discount for your subsequent articles • Submit your manuscript at: www.omicsonline.org/submission/ Citation: Trivedi MK, Branton A, Trivedi D, Nayak G, Singh R, et al. (2015) Characterization of Physical, Thermal and Spectroscopic Properties of Biofield Energy Treated p-Phenylenediamine and p-Toluidine. J Environ Anal Toxicol 5: 329. doi:10.4172/2161-0525.1000329 J Environ Anal Toxicol ISSN: 2161-0525 JEAT, an open access journal Volume 5 • Issue 6 • 1000329