Download
1 / 74
740 likes | 859 Views
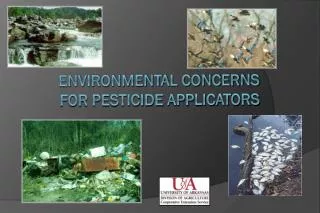
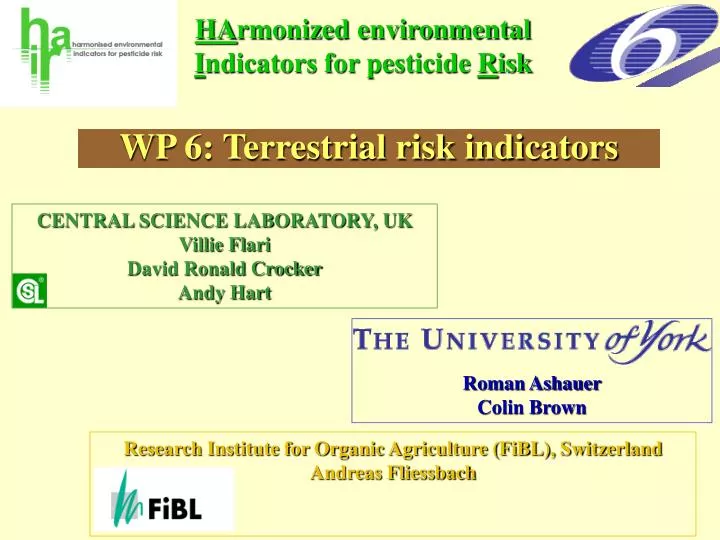
CENTRAL SCIENCE LABORATORY, UK Villie Flari David Ronald Crocker Andy Hart. Roman Ashauer Colin Brown. Research Institute for Organic Agriculture (FiBL), Switzerland Andreas Fliessbach. HA rmonized environmental I ndicators for pesticide R isk. WP 6: Terrestrial risk indicators.

E N D
CENTRAL SCIENCE LABORATORY, UK Villie Flari David Ronald Crocker Andy Hart Roman Ashauer Colin Brown Research Institute for Organic Agriculture (FiBL), Switzerland Andreas Fliessbach HArmonized environmental Indicators for pesticide Risk WP 6: Terrestrial risk indicators
Outline of assessed (& not assessed) risks and groups of organisms Outline of the plan of the indicators, incl. output and possible outcomes Example: detailed presentation, incl. algorithms, of bird acute and chronic risk indicator Aggregation policy in terrestrial risk indicator work package Example: inclusion of usage data Conclusions Terrestrial risk indicators
Outline of assessed (& not assessed) risks and groups of organisms Outline of the plan of the indicators, incl. output and possible outcomes Example: detailed presentation, incl. algorithms, of bird acute and chronic risk indicator Aggregation policy in terrestrial risk indicator work package Example: inclusion of usage data Conclusions Terrestrial risk indicators
Outline of assessed (& not assessed) risks and groups of organisms Outline of the plan of the indicators, incl. output and possible outcomes Example: detailed presentation, incl. algorithms, of bird acute and chronic risk indicators Aggregation policy in terrestrial risk indicator work package Example: inclusion of usage data Conclusions Terrestrial risk indicators
Outline of assessed (& not assessed) risks and groups of organisms Outline of the plan of the indicators, incl. output and possible outcomes Example: detailed presentation, incl. algorithms, of bird acute and chronic risk indicators Examples: inclusion of usage data - aggregation along time, space, actives Terrestrial risk indicators
Outline of assessed (& not assessed) risks and groups of organisms Outline of the plan of the indicators, incl. output and possible outcomes Example: detailed presentation, incl. algorithms, of bird acute and chronic risk indicators Examples: inclusion of usage data - aggregation along time, space, actives Aggregation in terrestrial risk indicator work package Terrestrial risk indicators
Outline of assessed (& not assessed) risks and groups of organisms Outline of the plan of the indicators, incl. output and possible outcomes Example: detailed presentation, incl. algorithms, of bird acute and chronic risk indicators Examples: inclusion of usage data - aggregation along time, space, actives Aggregation in terrestrial risk indicator work package Further indicators and Conclusions / possible shortfalls Terrestrial risk indicators
Outline of assessed (& not assessed) risks and groups of organisms Outline of the plan of the indicators, incl. output and possible outcomes Example: detailed presentation, incl. algorithms, of bird acute and chronic risk indicators Examples: inclusion of usage data - aggregation along time, space, actives Aggregation in terrestrial risk indicator work package Further indicators and conclusions / possible shortfalls Terrestrial risk indicators
Outline of assessed (& not assessed) risks and groups of organisms Outline of the plan of the indicators, incl. output and possible outcomes Example: detailed presentation, incl. algorithms, of bird acute and chronic risk indicators Examples: inclusion of usage data - aggregation along time, space, actives Aggregation in terrestrial risk indicator work package Further indicators and conclusions / possible shortfalls Terrestrial risk indicators
Micro-organisms Non-target plants Terrestrial invertebrates Non-target arthropods Honey bees Others Soil organisms Earthworms Other macro-organisms Terrestrial vertebrates Birds Mammals Direct toxic effects Acute Chronic/reproductive Indirect effects Impacts on food supply Impacts on habitat structure Biodiversity Other issues Persistence Bioaccumulation Metabolites Endocrine effects Terrestrial risks
Micro-organisms Non-target plants Terrestrial invertebrates Non-target arthropods Honey bees Others Soil organisms Earthworms Other macro-organisms Terrestrial vertebrates Birds Mammals Direct toxic effects Acute Chronic/reproductive Indirect effects Impacts on food supply Impacts on habitat structure Biodiversity Other issues Persistence Bioaccumulation Metabolites Endocrine effects Terrestrial risks
Micro-organisms Non-target plants Terrestrial invertebrates Non-target arthropods Honey bees Others Soil organisms Earthworms Other macro-organisms Terrestrial vertebrates Birds Mammals Direct toxic effects Acute Chronic/reproductive Indirect effects Impacts on food supply Impacts on habitat structure Biodiversity Other issues Persistence Bioaccumulation Metabolites Endocrine effects Terrestrial risks
Plan of terrestrial risk indicators Based upon most recent regulatory approaches
Plan of terrestrial risk indicators Based upon most recent regulatory approaches • SANCO/10329/2002: Guidance document on Terrestrial Ecotoxicology under Uniform Principles of EU Directive 91/414 • SANCO/4145/2000: Guidance document on Terrestrial Risk Assessment for Birds and Mammals under Uniform Principles of EU Directive 91/414
Plan of terrestrial risk indicators Based upon most recent regulatory approaches • SANCO/10329/2002: Guidance document on Terrestrial Ecotoxicology under Uniform Principles of EU Directive 91/414 • SANCO/4145/2000: Guidance document on Terrestrial Risk Assessment for Birds and Mammals under Uniform Principles of EU Directive 91/414 • EPPO Decision Making Schemes, 2003
Plan of terrestrial risk indicators • Basic Risk Indicator • Design: Reflects first tier regulatory decision making schemes
Plan of terrestrial risk indicators • Advanced Risk Indicator • Refined as HIGHER TIER is introduced • Basic Risk Indicator • Design: Reflects first tier regulatory decision making schemes
Plan of terrestrial risk indicators • Advanced Risk Indicator • Refined as HIGHER TIER is introduced • Basic Risk Indicator • Design: Reflects first tier regulatory decision making schemes Output Exposure to Toxicity ratio : ETR
Plan of terrestrial risk indicators • Advanced Risk Indicator • Refined as HIGHER TIER is introduced • Basic Risk Indicator • Design: Reflects first tier regulatory decision making schemes Output Exposure to Toxicity ratio : ETR Outcome USAGE DATA
Plan of terrestrial risk indicators • Advanced Risk Indicator • Refined as HIGHER TIER is introduced • Basic Risk Indicator • Design: Reflects first tier regulatory decision making schemes Output Exposure to Toxicity ratio : ETR Outcome USAGE DATA A NUMBER ETR
Plan of terrestrial risk indicators • Advanced Risk Indicator • Refined as HIGHER TIER is introduced • Basic Risk Indicator • Design: Reflects first tier regulatory decision making schemes Output Exposure to Toxicity ratio : ETR ETR Outcome A graphical representation of Usage + probable risk USAGE DATA Risk Classification
Archilochus colubris Sorex araneus Example: Vertebrate risk indicators • VERTEBRATES • Birds • Mammals
Archilochus colubris Sorex araneus Example: Bird risk indicators • VERTEBRATES • Birds • Mammals
Vertebrate prey Invertebrate prey Dietary (food) Seeds and fruits Vegetation Total oral exposure Granules / baits Other oral (non food) Preening TOTAL EXPOSURE Soil Surface water Dermal Water in the field Direct contact Inhalation Air Possible exposure routes for vertebrates in the field (EU, 2002)
Vertebrate prey Invertebrate prey Dietary (food) Seeds and fruits Vegetation Total oral exposure Granules / baits Other oral (non food) Preening TOTAL EXPOSURE Soil Surface water Dermal Route addressed by indicator Water in the field Route NOT addressed by indicator Direct contact Inhalation Air Possible exposure routes for vertebrates in the field (EU, 2002)
BAsic Bird Risk Indicator Phase I: Estimation of Exposure Estimated Theoretical Exposure (ETE) or Daily Dietary Dose (DDD)
BAsic Bird Risk Indicator Phase I: Estimation of Exposure Estimated Theoretical Exposure (ETE) or Daily Dietary Dose (DDD) Reasonable Worst Case (RWC) (as introduced in EU Guidance Documents
BAsic Bird Risk Indicator Phase I: Estimation of Acute Exposure Estimated Theoretical Exposure (ETE) or Daily Dietary Dose (DDD) Reasonable Worst Case (RWC) (as introduced in EU Guidance Documents & EPPO, 2003) Most Likely Case (MLC) (as introduced in EPPO, 2003)
BAsic Bird Risk Indicator Phase I: Estimation of Exposure Estimated Theoretical Exposure (ETE) or Daily Dietary Dose (DDD) Reasonable Worst Case (RWC) (as introduced in EU Guidance Documents & EPPO, 2003) Most Likely Case (MLC) (as introduced in EPPO, 2003) • Crop • Bird indicator species • Exposure standard scenario
Phase I: Estimation of Exposure a. Crop Indicator species BAsic Bird Risk Indicator Reasonable Worst Case (RWC) Most Likely Case (MLC)
Phase I: Estimation of Exposure a. Crop Indicator species BAsic Bird Risk Indicator Reasonable Worst Case (RWC) Herbivorous (3000g) Insectivorous (10g) Most Likely Case (MLC) Herbivorous (3000g)
Phase I: Estimation of Exposure a. Crop Indicator species BAsic Bird Risk Indicator Reasonable Worst Case (RWC) Herbivorous (3000g) Insectivorous (10g) Herbivorous (300g) Most Likely Case (MLC) Herbivorous (3000g) Omnivorous (300g)
Phase I: Estimation of Exposure a. Crop Indicator species BAsic Bird Risk Indicator Reasonable Worst Case (RWC) Herbivorous (3000g) Cereal shoots Insectivorous (10g) Insects Herbivorous (300g) Non-grass herbs Most Likely Case (MLC) Herbivorous (3000g) Cereal shoots Omnivorous (300g) 33% non-grass herbs 33% insects 33% seeds
Spraying • Granular application • Seed treatment BAsic Bird Risk Indicator Phase I: Estimation of Exposure b. Standard scenario
Spraying • Granular application • INTENTIONALLY • as food • as grit • ACCIDENTALLY • through soil consumption • as weed seeds • Seed treatment BAsic Bird Risk Indicator Phase I: Estimation of Exposure b. Standard scenario
Spraying • Seed treatment • Granular application • INTENTIONALLY • as food • as grit • ACCIDENTALLY • through soil consumption • as weed seeds BAsic Bird Risk Indicator Phase I: Estimation of Exposure b. Standard scenario
BAsic Bird Risk Indicator Phase I: Estimation of Acute Exposure c. Calculations (Crocker et al., 2002) Estimated Theoretical Exposure (ETE) or Daily Dietary Dose (DDD)
BAsic Bird Risk Indicator Phase I: Estimation of Acute Exposure c. Calculations (Crocker et al., 2002) Estimated Theoretical Exposure (ETE) or Daily Dietary Dose (DDD) ETE= [FIR/BW]*C*AV*PT*PD [mg a.s./kg BW/day] FIR: Food Intake Rate [g fresh weight food/day] C: Concentration [mg a.s./kg fresh weight food] BW: Body Weight [g] RWCMLC AV: Avoidance 1 1 PT: proportion of diet from treated area 10.5 PD proportion of food type in diet 1Depends on species
BAsic Bird Risk Indicator Phase I: Estimation of Acute Exposure c. Calculations (Crocker et al., 2002) Estimated Theoretical Exposure (ETE) or Daily Dietary Dose (DDD) ETE= [FIR/BW]*C*AV*PT*PD [mg a.s./kg BW/day] FIR: DEE/[FE*(1-MC/100)*(AE/100)][g fresh weight food/day] DEE: Daily Energy Expenditure [kJ/day] FE: Food Energy [kJ/g dry weight food] MC: Moisture content [%] AE: Assimilation Efficiency [%] C: RUD*AR*MAF [mg a.s./kg fresh weight food] RUD: Residue Unit Dose [normalised for 1kg a.s. on 1 ha] [mg a.s. / kg fresh weight food] AR: Application Rate [kg a.s. / ha] MAF: Multiple Application Factors RWCMLC AV: Avoidance11 PT: proportion of diet from treated area10.5 PD proportion of food type in diet1Depends on species
BAsic Bird Risk Indicator Phase I: Estimation of Acute Exposure c. Calculations (Crocker et al., 2002) Estimated Theoretical Exposure (ETE) or Daily Dietary Dose (DDD) ETE= [FIR/BW]*C*AV*PT*PD [mg a.s./kg BW/day] FIR: DEE/[FE*(1-MC/100)*(AE/100)][g fresh weight food/day] DEE: Daily Energy Expenditure [kJ/day] FE: Food Energy [kJ/g dry weight food] MC: Moisture content [%] AE: Assimilation Efficiency [%] C: RUD*AR*MAF [mg a.s./kg fresh weight food] RUD: Residue Unit Dose [normalised for 1kg a.s. on 1 ha] [mg a.s. / kg fresh weight food] RWCMLC 90th50th AR: Application Rate [kg a.s. / ha] MAF: Multiple Application Factors: 90th RWCMLC AV: Avoidance11 PT: proportion of diet from treated area10.5 PD proportion of food type in diet1Depends on species
BAsic Bird Risk Indicator Phase I: Estimation of Chronic Exposure c. Calculations (Crocker et al., 2002) Estimated Theoretical Exposure (ETE) - sum for 3 weeks ETE= [FIR/BW]*C*AV*PT*PD [mg a.s./kg BW/day] FIR: DEE/[FE*(1-MC/100)*(AE/100)][g fresh weight food/day] DEE: Daily Energy Expenditure [kJ/day] FE: Food Energy [kJ/g dry weight food] MC: Moisture content [%] AE: Assimilation Efficiency [%] C: Co*MAF*ftwa [mg a.s./kg fresh weight food] AR: Application Rate [kg a.s. / ha] RWC MLC AV: Avoidance 1 1 PT: proportion of diet from treated area 1 0.5 PD proportion of food type in diet 1 Depends on species
BAsic Bird Risk Indicator Phase I: Estimation of Chronic Exposure c. Calculations (Crocker et al., 2002) Estimated Theoretical Exposure (ETE) - sum for 3 weeks ETE= [FIR/BW]*C*AV*PT*PD [mg a.s./kg BW/day] FIR: DEE/[FE*(1-MC/100)*(AE/100)][g fresh weight food/day] DEE: Daily Energy Expenditure [kJ/day] FE: Food Energy [kJ/g dry weight food] MC: Moisture content [%] AE: Assimilation Efficiency [%] C: Co*MAF*ftwa [mg a.s./kg fresh weight food] AR: Application Rate [kg a.s. / ha] RWC MLC AV: Avoidance 1 1 PT: proportion of diet from treated area 1 0.5 PD proportion of food type in diet 1 Depends on species
ftwa : Time Weighted Averaged Factors when DT50<10 days k=ln2/DT50 velocity constant t=averaging time BAsic Bird Risk Indicator • Vegetation: exponential degradation is assumed C: Co*MAF*ftwa[mg a.s. / kg fresh weight food] Co: Initial concentration after a single application[mg a.s. / kg fresh weight food] MAF: Multiple Application Factors Deterministic in EU based on DT50=10 days n=number of applications i=interval between applications
BAsic Bird Risk Indicator • Insects: degradation is not known • population movements are not modelled • Seeds: degradation is not known Deterministic value Arithmetic mean Large insects 5.1 mg/kg Small insects 29.0 mg/kg Probabilistic value Distribution e.g. as in Roelofs et al., 2005
BAsic Bird Risk Indicator Phase II: Estimation of Toxicity a. Toxicity figures Lowest toxicity figure Geometric Mean, e.g.: When >1 LD50 or NOEC for same species Chronic LC50 or GM LC50 Daily Dose [mg a.s. / kg BW / day] (LC50*FIR)/BW
BAsic Bird Risk Indicator Phase II: Estimation of Toxicity b. Extrapolation factors Number of species for which LD50 are available <66 (Luttik & Aldenberg, 1997) 5th percentile SSD=GMtoxicity figure/EF GM: Geometric Mean EF: Extrapolation Factor EFs for: median 95% CL
BAsic Bird Risk Indicator Phase II: Estimation of Toxicity b. Extrapolation factors Number of species for which LD50 are available <66 (Luttik & Aldenberg, 1997) (Aldenberg & Slob, 1993) 5th percentile SSD =GMtoxicity figure/EF GM: Geometric Mean EF: Extrapolation Factor EFs for: median 95% CL 5th percentile SSD=10 (log meantoxicity figure-EF*SD) EF: Extrapolation Factor SD: Standard Deviationtoxicity figure EFs for: median 95% CL
BAsic Bird Risk Indicator Phase III: Output • Exposure to Toxicity ratio b. Classification of risk
BAsic Bird Risk Indicator Phase III: Output • Exposure to Toxicity ratio b. Classification of risk Demonstrating usage data Aggregating at a later stage
Worked examples AR (kg/ha) ETR 3Toxicity figure 0 0 1 -3.3 1 0.32 3.255 1Root crops-4Aldicarb 1.5 0.95 4 -100 0.25 5826 188.7 2Wheat-5Carbendazim 1 0.63 5 -100 0.72 3.6 32 2Wheat-5Chlorpyrifos 0 0 3 0 0.675 10.50 0.9 2Wheat–5Dimethoate 4 RWC-MLC: Herbivorous (300g) 5 RWC-MLC: Herbivorous (3000g) 1 Granules consumed intentionally as grit 2 Spraying standard scenario 3 Lowest (or single) LD50 or 5th percentile SSD