Download
1 / 59
590 likes | 727 Views
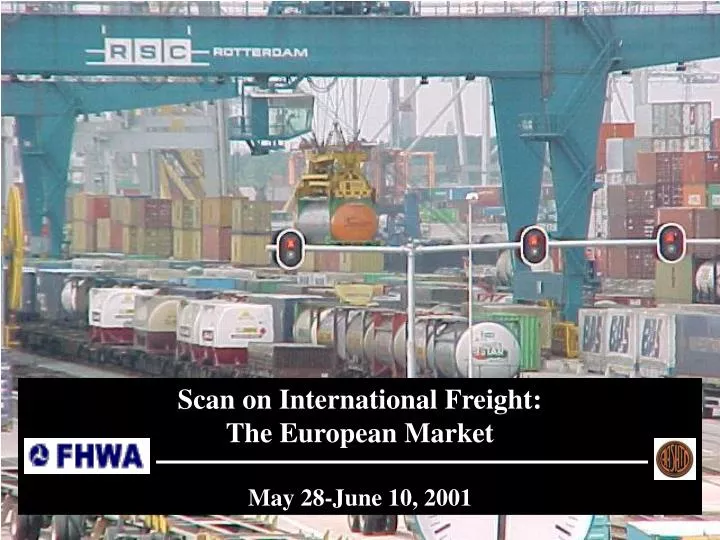
Scan on International Freight: The European Market May 28-June 10, 2001. Scan panel included representatives from : The Federal Highway Administration and Ministries of Transport from Canada and Mexico American Association of State Highway and Transportation Officials

E N D
Scan on International Freight: The European Market May 28-June 10, 2001
Scan panel included representatives from: • The Federal Highway Administration and Ministries of Transport from Canada and Mexico • American Association of State Highway and Transportation Officials • Florida, Ohio, and Minnesota Departments of Transportation • MPO—Chicago Area Transportation Study (CATS) • Intermodal Research and Education Foundation • University
Mission To identify challenges, opportunities, government strategies and market responses associated with the European Union experience in forming a common market….and relating them to the North American context, such as: --National and sub-national freight investment decisions --Public/private sector freight initiatives --NAFTA
Panel met with representatives from: • Government • The Netherlands’ Ministry of Transport, Public Works, and • Water Management • EU—Directorate General for Energy and Transport • Ports of Rotterdam and Gioia Tauro (Italy) • Facility Developers/Operators • The Netherlands: Betuweroute, Rail service center, port • terminal operator (ECT) • Medcenter container terminal (Gioia Tauro) • Freight village (Verona, IT) • Frankfurt (GER) airport
Private Sector Service Providers • Railion (The Netherlands) • Maersk (Italy) • CEMAT (Italy) • HUPAC Intermodal (Switzerland) • LKW Walter International/Trucking/Intermodal (Austria) • Logistics Service Providers • Holland International Distribution Council • Kombi verkehr (Germany)
Freight Transport, billion tonne-kms, 1997 EU-15 US Road 1,205 1,534 Rail 238 2,165 Inland water 118 520 Pipeline 85 901 Short sea 1,124 511 Source: EU Statistical Pocketbook, 2000 (Note: 1 ton-mile = 1.46 tonne-kilometer)
Mode Split (Tonne-kms) Ave Distance (kms) EU-15 US EU-15 US Road 44% 28 110 685 Rail 8 37 245 1,355 Inland water 4 10 280 767 Pipe 3 17 170 1,224 Sea 41 8 1,430 na Freight Mode Split and Average Trip Distance
Freight Transportation Challenges Facing EU • Substantial increases in passenger and freight • movement over the past 20 years have led to significant • levels of road and freight/passenger terminal congestion • Many freight transport movements occur on same • facilities as passenger movement (e.g. rail and road systems) • creating pressures on facility space management • Strategic geographic barriers • hinder easy continent-wide • transportation(e.g., English • Channel, the Alps, etc.)
Level of transport infrastructure development varies • across EU countries • Historically, national transport systems were designed for • national defense purposes to constrain cross boundary • movements, leaving a legacy in some cases ofincompatible • operational systems and design • Transport policy is integrally linked • to EU and national policies on • environment/sustainability/ • energy; this leads to differences • of opinion on most appropriate • transport investment policies
Changing global economy has challenged logistics and the entire production/distribution process • Freight modal distribution hassteadily shifted toward • truck and short sea movements
Road Short sea Billion tonne-kilometers Rail Inland water Pipeline EU Transport System Freight Use, 1970-1998 (billion t-km) (Note: 1 ton-mile = 1.46 tonne-kilometer)
Road Short sea % Rail Inland water Pipeline EU Transport System Freight Mode Split, 1970-1998
Public Sector--European Union (EU) The EU created to establish common economic market and to deal with history of conflict; coordination and development of EU’s transport system was one of the first areas of attention Major focus of initial EU efforts was on developing free competition and consistent interoperability Strong policy linkage between transport goals and environment/sustainability/energy goals; major policy approach has been to establish target market shares for modes
Road Short sea % Reversal of these trends is the focus of EU and national policies Rail Inland water Pipeline EU Transport System Freight Mode Split, 1970-1998
EU has several roles: • Ø Advocates common principles and interests • Ø Facilitates multi-country activities • Ø Coordinatesmulti-country planning, policy and • research activities • Ø Establishes EU vision and policy for EU/member state • action • Ø Provides varying levels of funding support for EU • priority projects
ØTargetshuman resource development/training in transportation projects • Ø Establishes legally binding rules and regulations for such things as safety and vehicle characteristics (e.g., infrastructure manager for railroads should be different from operator) • Ø Monitors member nation actions and, if necessary, takes to action to European Court
Common Transport Policy • “Sustainable mobility is the core purpose of the Common Transport Policy. • The Commission has been developing policy approaches that will encourage the establishment of public/private investment and development partnerships. • The Community has an obligation to pursue measures to improve transport safety. • (The) rail, road, maritime and aviation systems…must also be made interoperable.
(It) is essential to make much better use of what exists. • Intermodality…could transform the ease and efficiency of movement. • Any pricing and charging system must clearly and fairly relate to the infrastructure and external costs caused by use… • To protect the legitimate interest of consumers and competitors in transport as elsewhere, the competition rules that help to sustain the vitality of the market system have to be applied.”
Policy Priorities • European Single Sky • Clean Urban Transport • Sustainability • Interoperability and intermodality • Intelligent transport systems • Maritime safety
1992 Maastricht Treaty fostered development of trans-European transport network (TEN-T) Program of improvement that includes 100’s of projects (EUR 400 to 500 billion cost) 14 priority corridor improvements (EUR 100 billion) Funding: 50% for feasibility studies 10 % for construction (85% for accession states) EUR 18 billion from 2001 to 2006; expected to trigger between EUR 60 to 100 billion; Historically, however, EU investment has triggered only 30% match
Trans-European Transport Network The 14 Priority Projects 1. High-Speed Train/Combined transport N/S 2. High-Speed Train PBKAL 3. High-Speed Train South 4. High-Speed Train East 5. Betuwe Line, Conventional rail/Combined transp. 6. High-Speed Train/Combined transp. France-Italy 7. Greek Motorways Pathe and Via Egnatia 8. Multimodal Link Portugal-Spain-Central Europe 9. Conventional rail Cork-Dublin-Belfast-Stranraer 10. Malpensa Airport, Milano 11. Øresund Fixed Rail/road link Denmark-Sweden 12. Nordic Triangle Multimodal Corridor 13. Ireland/United Kingdom/Benelux road Link 14. West Coast Main Line 12 14 9 11 13 5 5 1 2 4 10 6 8 3 7
Establishment and development of connections, key • links, and interconnections needed to eliminate • bottlenecks, fill in missing sections and complete • major routes; • Establishment and development of infrastructure for access to the network, making it possible to link island, landlocked and peripheral regions with the central regions of the Community; • The optimum combination and integration of the • various modes of transportation; • ØIntegration of environmental concerns into the • design and development of the network;
Gradual achievement of interoperability of network components; • Ø Optimization of the capacity and efficiency of • existing infrastructure; • Ø Establishment of and improvement in • interconnection points and intermodal platforms; • Ø Improved safety and network reliability; • Ø The development and establishment of systems for • the management and control of network traffic and • user information with a view to optimizing use of • the infrastructure
Changing budget programming to multi-year • Maximum of 75%: 45% goes to public/private • projects, 20% to GPS implementation, and 35% to • rest of projects for which there are over 200 • requests (EUR 1billion of needs for which only • EUR 137 million available) • Risk capital on projects outside of program • Galileo system
Customs 2002 • Realizing that the abolition of internal border checks requires enhanced clearances and controls at external borders, the EU has adopted the following strategy, called Customs 2002, for providing coordinated EU-wide external border controls. • · Identification of best practices among member states • · Collection, analysis and exploitation of data to combat fraud • · Support for customs administrations to improve internal • administrative structures, e.g.., risk analysis, post- • importation audits, and computerization. • · Exchange of customs officials among member states • · Training that disseminates best practices. • Computerization of customs procedures throughout the EU
Enlargement of EU • 13 countries are seeking membership • Must adopt entire body of EU rules and regulations • Financial assistance; in 2000, EUR 3.2 billion • provided to candidate countries with EUR 1 billion • for transport and environmental systems • From 2001 to 2006, EUR 22 billion for pre- • accession support; EUR 57 billion for new members • Significant budget for training
Types of studies Competitiveness of national rail systems Application of road user charges Costs of upgrading infrastructure in each country Forecasting demand in 10 pan-European corridors Road and maritime safety Environmental concerns incorporated into decisions?
Public Sector--Member Nations Member nations are responsible for implementing EU policies and directives; little enforcement of this response unless issue is of such significance that it goes to European Court Linkage to broader societal goals Consistency with EU policies Focus on existing transport system infrastructure and technology Investment in freight infrastructure
Better use of existing options leads to interest in intermodal Market-driven transport policy Public/private partnerships have been used to provide joint investment in freight infrastructure Trend toward separating freight infrastructure ownership from operations responsibility National planning emphasizes freight and role in economic development
Public Sector--Local Governments Several examples found of local government financial support of freight infrastructure Success of these initiatives was related to ability of local officials to link economic development objectives with broader community goals Competitive advantage in a global, or at least European, market was a key driving force
Private Sector (carriers/logistics companies/terminal • operators) • Focused on rationalization of services and operations with strategies to increase economies of scale • larger ships and ports • block trains/unit trains/shuttles • freight villages • intermodal consolidation terminals • automated operations • Trend toward more hub operations • Intermodal freight movement has been important for handling increasing freight movements
Some Examples…. Facility Service Investment --The Betuwe corridor --Port of Rotterdam --Swiss shuttle trains --Verona Freight Village --Gioia Tauro port development Institutional Framework --Dutch program on logistics efficiency --German public investment in intermodal terminals
Inland Water Motorways Short Sea Rail
Port of Rotterdam • Gateway to Europe; 80% of freight destined elsewhere • Delta Terminal provides 24/7 operations; automation • Rail service centers and shuttle trains; targeting 20% • share • Large scale investment on part of government, port, • and private sector
The Betuwe Corridor First railway in Holland designed exclusively for freight Connects Rotterdam to Germany with 160 kms of track Approximate $4 billion in investment; Contributions from The Netherlands, EU, and private sector Separation of infrastructure ownership and operations
Gioia Tauro Port Development New container port in southern Italy designed to act as trans-shipment point for containers coming from Asia and Middle East 1993--0 movements 2000--2.7 million TEUs; 3,060 vessel calls; 95% trans-shipment to other vessels Expansion plans for larger vessels and creation of European Free Trade Zone
Estimated government investment $50 million; $250 million from terminal operators; EU provides funds for training Investment being made (with EU support) for improved rail access to Europe; Port officials view this as important in making Gioia Tauro possible intermodal port to northern markets
Swiss Shuttle Trains Switzerland not a member of the EU; has agreements with EU concerning transport Alps serves as significant barrier to freight movement along north-south axis; Swiss also had more stringent truck weight limits Swiss have imposed new truck tolls of $200/truck at border Part of strategy is to provide shuttle trains for containers or trailers
Verona Freight Village • One of largest intermodal service • centers in Italy; handles • 30% of Italy’s intermodal traffic • 2.5 million m2 of space • Includes office center, rail service yard, customs, • warehouses, forwarding agent center, and logistics • center
The Netherlands: ‘Transactie Modal Shift’Program • Provides government funds to shippers to conduct logistics • scans and to develop long-term plans for more efficient goods • movement • Proposed actions have included: • Development of new logistics strategies (e.g., reduction in • scheduled deliveries and improved route planning) • Changes in transport technology (e.g., use of sea • containers) • Consolidation of freight distribution activities at freight • centers • Enhanced training to improve vehicle fuel efficiency.
From 1997 to 2000 • --200 logistics efficiency scans • --100 mode shift scans • --50 integrated scans • --142 implemented projects. • Seventy-five of the mode shift scans showed the possibility • of using intermodal services • Approximately 10 percent of these cases, such service was • cheaper than existing truck service. • Estimated reduction of 72 million vehicle-kilometers due • to more efficient logistics strategies; 18 million vehicle • kilometers due to targeted mode shift strategies.
German government provides funds for construction or expansion of intermodal terminals that include the exchange of freight from truck to rail, inland barge, or coastal shipping. Ø The terminal improvement must not be economically viable solely with private financing. Ø The terminal operator must be different than the organization that owns the terminal Ø Open access to the terminal improvements will be allowed to all who desire to use the operation Ø An intermodal facility or facility expansion is planned in the region by one of the intermodal carriers