The Cost of Capital
The Cost of Capital. Chapter 9. Oct 17, 2012. Learning Goals. Determining the value of K, the required rate of return for an investor Sources of capital funding (Debt, Equity) Cost of each type of funding Calculation of the weighted average cost of capital funding (WACC) = K

The Cost of Capital
E N D
Presentation Transcript
The Cost of Capital Chapter 9 Oct 17, 2012
Learning Goals • Determining the value of K, the required rate of return for an investor • Sources of capital funding (Debt, Equity) • Cost of each type of funding • Calculation of the weighted average cost of capital funding (WACC) = K • Construction and use of the marginal cost of capital schedule (MCC) for decision making
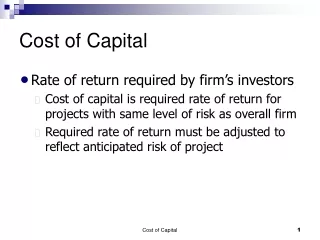
Cost of Capital • Capital is the term used by firms for funds needed for investment purposes, i.e., capital equipment (not for day to day operating needs) • This capital carries a cost because each source of capital funding costs money to raise (i.e., issuing stock costs a lot of money)
Cost of Capital • To properly evaluate investment decisions, the firm must know how much it will cost them to raise capital funds from all sources • WACC = K = hurdle rate • If it costs more to raise the capital (K) than you make on your investment, then you don’t make the investment!
Sources of Capital • Borrowing: issue Bonds, bank loans, • Issuing Preferred stock • Issuing Common stock • Net Income (earnings) • Each of these sources carries a different cost based on the required rate of return of each provider (source) of these funds
Optimal Capital Structure • The capital structure of a firm is how the firm has elected to finance its assets • It is the level or percentage of total assets financed by debt, preferred stock and common equity (common stock and retained earnings) • Each firm has an optimal level of debt and equity at which it can operate most efficiently and profitability (Draw curve)
Weighted Cost of Capital Model • Compute the cost of each source of capital, i.e., debt, preferred stock, common stock, retained earnings • Determine percentage (weights) of each source of capital in the firm’s optimal capital structure • Calculate Weighted Average Cost of Capital (WACC)
1. Compute Cost of Debt • Required rate of return for creditors • e.g. Suppose that a company issues bonds with a before tax cost of 10%. • Since interest payments are tax deductible, the true cost of the debt is the After Tax cost (ATkd = Int Rate (1 – T), where T is tax rate) • If the company’s tax rate (state and federal combined) is 40%, the after tax cost of debt AT kd = 10%(1-.4) = 6% (show example)
Flotation Costs – cost of issuing securities to the general public • Accounting • Legal • Prospectus – (pass out examples) • Underwriting (investment banker) • Filing Fees (SEC)
Dividend (Dp) Market Price (PP) - F Required rate kp = 2. Compute Cost Preferred Stock • Cost to raise a dollar of preferred stock. • Dp = preferred stock dividend • Pp = Market price per share • F = flotation costs per share • Flotation costs reduce the amount of money you get when you sell preferred stock
$5.00 = $42.00 kp = Cost of Preferred Stock • Example: You can issue preferred stock with a market price of $45, and flotation costs of $3 per share, for a net price of $42 and if the preferred stock pays a $5 dividend, • The cost of preferred stock: 11.9% (vs 11.1%)
3. Compute Cost of Common Equity • Two Types of Common Equity Financing • Retained Earnings (internal common equity) • Issuing new shares of common stock (external common equity)
3. Compute Cost of Common Equity • Cost of Common Equity (Retained Earnings) • Management should retain earnings only if they earn as much as stockholder’s next best investment opportunity of the same risk. • Cost of Common Equity = opportunity cost of common stockholders’ funds. • Two methods to determine • Dividend Growth Model • Capital Asset Pricing Model
D1 P0 kS = + g 3. Compute Cost of Common Equity • Cost of Common Equity (Retained Earnings) • Dividend Growth Model Ks = cost of internal common equity D1 = the next dividend to be paid Po = the current market price of the stock g = the projected rate of growth of the company
D1 P0 kS = + g 3. Compute Cost of Common Equity • Cost of Internal Common Equity • Dividend Growth Model • Example: • The market price (Po) of a share of common stock is $60. The prior dividend paid (D0) was $3, and the expected growth rate (g) is 10%. If you are given D0, you must calculate D1 D1 = D0 (1 + g) D1 = 3.00 (1.10) = 3.30
D1 P0 kS = + g 3.30 60 kS = + .10 3. Compute Cost of Common Equity • Cost of Internal Common Equity • Dividend Growth Model • Example: • The market price of a share of common stock is $60. The prior dividend (D0) is $3, and the expected growth rate is 10%. (D1 = 3.00 x 1.10 = 3.30) =.055 + .10 = 15.5%
D1 P0 - F kn = +g 3. Compute Cost of Common Equity • Cost of New Common Stock • Must adjust the Dividend Growth Model equation for flotation (F) costs of the new common shares. Kn = cost of sale of new common stock D1 is the next dividend to be paid Po is the current market price of shares outstanding F is the flotation cost G is the rate of growth
3.30 52.80 kn = + .10 3. Compute Cost of Common Equity • Example: • If additional shares are issued, floatation costs will be 12% of price per share. D0 = $3.00 and estimated growth is 10%, Price is $60 as before. Flotation cost = $60 x .12 = $7.20. • (Po – F = $60.00 – 7.20 = $52.80) (D1 = 3.00 x 1.10 = 3.30) = .0625 + .10 = 16.25%
Source of Capital Cost Bonds (after tax) kd = 6.0% Preferred Stock kp = 11.9% Common Stock Retained Earnings ks = 15.5% New Shares kn = 16.25% Weighted Average Cost of Capital Gallagher Corporation estimates the following costs for each component in its capital structure: Gallagher’s tax rate is 40%
WACC = (WTd x AT kd ) + (WTp x kp ) + (WTs x ks) Weighted Average Cost of Capital • If using retained earnings (Internal Equity) to finance the equity portion: WACC = weighted average cost of capital WT = the weight, or percentage of each element of capital (% of debt, preferred and common stock to total assets) ATkd = after tax cost of debt Kp = Cost of preferred stock Ks = Cost of equity (Internal – retained earnings)
WACC= ka= (WTd x AT kd ) + (WTp x kp ) + (WTs x ks) Weighted Average Cost of Capital • If using retained earnings (internal equity) to finance the common equity portion : • Assume that Gallagher’s desired capital structure is 40% debt, 10% preferred and 50% common equity.
WACC = (WTd x AT kd ) + (WTp x kp ) + (WTs x ks) Weighted Average Cost of Capital • If using retained earnings (Internal Equity) to finance the equity portion: • Assume that Gallagher’s desired capital structure is 40% debt, 10% preferred and 50% common equity. WACC = Cost of Debt .40 x 6.0% = 2.40% + Cost of Preferred .10 x 11.9% = 1.19% + Cost of Int. Equity .50 x 15.5% =7.75% 1.00 = 11.34%
WACC = (WTd x AT kd ) + (WTp x kp ) + (WTs x ks) Weighted Average Cost of Capital • If using new common stock (External Equity) to finance the common stock portion: Then we must use the cost of stock adjusted for the Flotation costs WACC = Cost of Debt .40 x 6.0% = 2.40% + Cost of Pref .10 x 11.9% = 1.19% + Cost of Ext. Eq. .50 x 16.25% = 8.13% =11.72%
Marginal Cost of Capital • Gallagher’s weighted average cost will change if one component cost of capital changes. • This may occur when a firm raises a particularly large amount of capital such that investors think that the firm is riskier. • The WACC of the next dollar of capital raised is called the marginal cost of capital.
Spending Capital Money • The assumption is that the capital money is spent in direct proportion to the optimal capital structure. • So, if we spend $100,000, it would be in the following proportions: Capital StructureSpend Debt 40% 40,000 Preferred 10% 10,000 Common 50% 50,000 (Buckets) Total 100,000
Available Retained Earnings Breakpoint = Equity Percentage of Total Calculating the Breakpoint • Assume now that Gallagher Corporation has $100,000 in retained earnings with which to finance its capital budget. • We can calculate the point at which they will need to issue new equity since we know that Gallagher’s desired capital structure calls for 50% common equity.
Calculating the Breakpoint Breakpoint = ($100,000)/.5 = $200,000 • What this means is that once we spend $200,000 in total on capital projects, we will have used up our retained earnings of $100,000 (internal equity). • Therefore, if we spend over $200,000, we will need additional financing from the issue of new shares of stock since 50% of our spending must come from Equity. • The cost of issuing new shares is greater than internal equity due to flotation costs
Marginal weighted cost of capital curve: 11.72% 13% 11.34% 12% Weighted Cost of Capital 11% 10% 400,000 0 100,000 200,000 300,000 TotalFinancing Making Decisions Using MCC Usingnew common equity Using internal common equity
Marginal weighted cost of capital curve: 12% 11% Project 1 IRR = 12.4% Project 2 IRR = 12.1% Project 3 IRR =11.5% Weighted Cost of Capital 10% 9% 400,000 0 100,000 200,000 300,000 TotalFinancing Making Decisions Using MCC • Graph IRRs of potential projects
Marginal weighted cost of capital curve: 11.72% 12% 11.34% 11% Project 1 IRR = 12.4% Project 2 IRR = 12.1% Project 3 IRR =11.5% Weighted Cost of Capital 10% 9% 400,000 0 100,000 200,000 300,000 TotalFinancing Making Decisions Using MCC • Graph IRRs of potential projects Graph MCC Curve
Marginal weighted cost of capital curve: 11.72% 12% 11.34% 11% Project 1 IRR = 12.4% Project 2 IRR = 12.1% Project 3 IRR =11.5% Weighted Cost of Capital 10% 9% 400,000 0 100,000 200,000 300,000 TotalFinancing Making Decisions Using MCC • Graph IRRs of potential projects • Graph MCC Curve • Choose projects whose IRR is above the weighted marginal cost of capital Accept Projects #1 & #2
MCC and Capital Budgeting Decisons • See pages 250 – 256 • Calculate the breakpoints Calculate the new MCC’s Plot MCC’s and Investment Projects • See Figures 9-5 and 9-6 for results • Do all the Self-test problems before doing the homework