Download
1 / 15
160 likes | 345 Views
Self Similar Traffic. Self Similarity. The idea is that something looks the same when viewed from different degrees of “magnification” or different scales on a dimension, such as the time dimension.

E N D
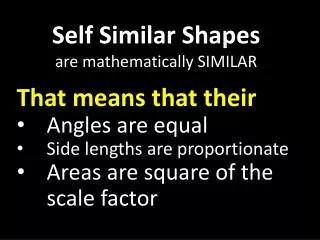
Self Similarity • The idea is that something looks the same when viewed from different degrees of “magnification” or different scales on a dimension, such as the time dimension. • It’s a unifying concept underlying fractals, chaos, power laws, and a common attribute in many laws of nature and in phenomena in the world around us.
Cantor Each left portion in a step is a full replica of the preceding step
What is a Fractal? • Exhibits self-similarity • Unique dimensionality • Based on recursive algorithms • Scale independent
Network Traffic in the Real World • For years, traffic was assumed to be based on Poisson. • It is now known that this traffic has a self similar pattern. • Characterized by burstiness.
Self Similarity of Ethernet Traffic • Seminal paper by W. Leland et al published in 1993, examined Ethernet traffic between 1989 and 1992, gathering 4 sets of data, each lasting 20 to 40 hours, with a resolution of 20 microseconds. • Paper shattered the illusion of Poison distribution being adequate for traffic analysis. • Proved Ethernet traffic is self similar with a Hurst factor of H = 0.9 • 0 < H <1 ; the higher H, the more self similar the pattern
Self-similarity: manifestations • Self-similarity manifests itself in several equivalent fashions: • Slowly decaying variance • Long range dependence • Non-degenerate autocorrelations • Hurst effect
Definition of Self-Similarity • Self-similar processes are the simplest way to model processes with long-range dependence – correlations that persist (do not degenerate) across large time scales • The autocorrelation function r(k) of a process (statistical measure of the relationship, if any, between a random variable and itself, at different time lags)with long-range dependence is not summable: • Sr(k) = inf. • r(k) @ k-b as k g inf. for 0 < b < 1 • Autocorrelation function follows a power law • Slower decay than exponential process • Power spectrum is hyperbolic rising to inf. at freq. 0 • If Sr(k) < inf. then you have short-range dependence
Self-Similarity contd. • Consider a zero-mean stationary time series X = (Xt;t = 1,2,3,…), we define the m-aggregated series X(m) = (Xk(m);k = 1,2,3,…) by summing X over blocks of size m. We say X is H-self-similar if for all positive m, X(m) has the same distribution as X rescaled by mH. • If X is H-self-similar, it has the same autocorrelation function r(k) as the series X(m) for all m. This is actually distributional self-similarity. • Degree of self-similarity is expressed as the speed of decay of series autocorrelation function using the Hurst parameter • H = 1 - b /2 • For SS series with LRD, ½ < H < 1 • Degree of SS and LRD increases as H g 1
Graphical Tests for Self-Similarity • Variance-time plots • Relies on slowly decaying variance of self-similar series • The variance of X(m) is plotted versus m on log-log plot • Slope (-b) greater than –1 is indicative of SS • R/S plots • Relies on rescaled range (R/S)statistic growing like a power law with H as a function of number of points n plotted. • The plot of R/S versus n on log-log has slope which estimates H • Periodogram plot • Relies on the slope of the power spectrum of the series as frequency approaches zero • The periodogram slope is a straight line with slope b – 1 close to the origin