Greengineering: Optimal Urban Wind Turbine Selection Model for Personalized Needs
Greengineering is an innovative MATLAB-based model designed to streamline the selection of optimal wind turbines for urban areas in the United States. Users input crucial information such as location, building height, budget, weight limits, and surface area, and the model outputs the most efficient turbines tailored to their specifications. It includes a comprehensive database of urban wind turbines and wind data for 50 major cities. Key features consist of turbine specifications, projected power generation, total costs, savings, and visual representations, simplifying the decision-making process for clients.

Greengineering: Optimal Urban Wind Turbine Selection Model for Personalized Needs
E N D
Presentation Transcript
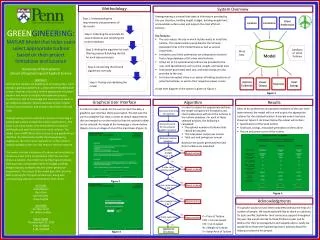
Methodology System Overview Location Limitations Client Preferences • Greengineering is a model that takes in information provided by the user (location, building height, budget, building weight limit, and available surface area) and outputs the most efficient turbines. • Key Features: • The user selects the city in which he/she wants to install the turbine. The model contains wind data for the 50 most populated cities in the United States as well as several Universities. • Limitations and client preferences are compared to turbines from a large database of 50 urban wind turbines. • A final list of 1-3 optimal wind turbines are provided to the user, with specifications such as price, weight, and swept area. • Total power generated, total cost, and total savings are also provided to the user. • For those interested, there is an option of looking at pictures of potential turbines, as well as their respective power curves. • A high level diagram of the system is given on Figure 1. Model Wind Data Database of Wind Turbines GREENGINEERING: MATLAB Model that helps users select appropriate turbine based on their project limitations and location University of Pennsylvania School of Engineering and Applied Science ABSTRACT: As fossil fuel supplies are depleting at increasing rates, wind energy is gaining popularity as a clean and renewable power source. However, choosing a turbine appropriate for a given location and needs is a lengthy and expensive process. Furthermore, lack of knowledge and resources can result in an inefficient selection. Recent examples of poor turbine choices have resulted in lack of power generation and high costs. Greengineering aims to simplify the process of selecting an appropriate turbine to meet the client’s specifications. The focus is on urban areas in the United States to allow for individuals and small institutions to install turbines. The model runs in MATLAB and has an easy-to-use graphical user interface. To additionally simplify the Greengineering experience, the information required to run the model is readily available to the user and requires minimal research. The model includes a database of turbines and wind data for numerous cities in the United States. After the user has chosen a location, the model runs by filtering out turbines that would be unacceptable based on budget, building weight capacity, available area and power generation requirement. The output of the model gives the client the best turbine(s) for the given preferences, along with accompanying statistics to facilitate the final choice. AUTHORS Shahid Bosan Dara Elass Aarti Kochhar Divya Singhal ADVISORS Dr. Peter Scott Mr. Walter Sobkiw DEMO TIMES Thursday April 21, 2010 9:00-10:30AM 2:30-3:00PM Optimal Turbine(s) Power Output Total Cost Total Savings Accesses wind data for location Calculates wind for the entered height in location Accesses turbine database Is client budget max. > P? No Figure 1 Reject turbine Graphical User Interface Algorithm Results Yes • In order to output the appropriate turbines, the model compares the limitations and client preferences with all of the turbines in the turbine database. For each of these selected turbines, the following is calculated: • The optimal number of turbines that should be installed • The total power output per annum • Total cost and savings per annum • Based on the power generated the best three turbines are outputted. Is max. wind velocity ≤ COS ? • After all the preferences and project limitations of the user have been entered, the model will run and output the appropriate turbines for the selected location. A sample output has been shown on Figure 4. As shown below the output will contain: • Specifications of the wind turbine • Total cost, savings, and power generation of the turbine • Picture and power curve of the turbine In order to make it easier for the user to input the data, a graphical user interface (GUI) was created. The GUI asks the user to complete four steps in order to obtain requirements that are needed to run the model so that the optimal turbine can be selected. An image of the homepage is shown below (Figure 2) as is an image of one of the input steps (Figure 3). No Reject turbine Yes No Is min. wind velocity ≥ CIS ? Reject turbine Yes No Is client weight limit ≥ W ? Reject turbine Yes No Is client swept area ≥ S ? Reject turbine Yes Optimal list of turbines Figure 2 Figure 4 Acknowledgments This project could not have been completed without the help of a number of people. We would especially like to thank our advisors, Dr. Scott and Mr. Sobkiw for their continuous support throughout the year. We would also like to thank Professor Laker and Dr. Watrous for their encouragement and valuable advice. Lastly we would like to thank the Engineering Dean’s Advisory Board for helping us conceive the project. P = Price of Turbine COS = Cut-out-speed CIS = Cut-in-speed W = Weight of Turbine S = Swept Area of Turbine Figure 3