Download
1 / 22
220 likes | 352 Views
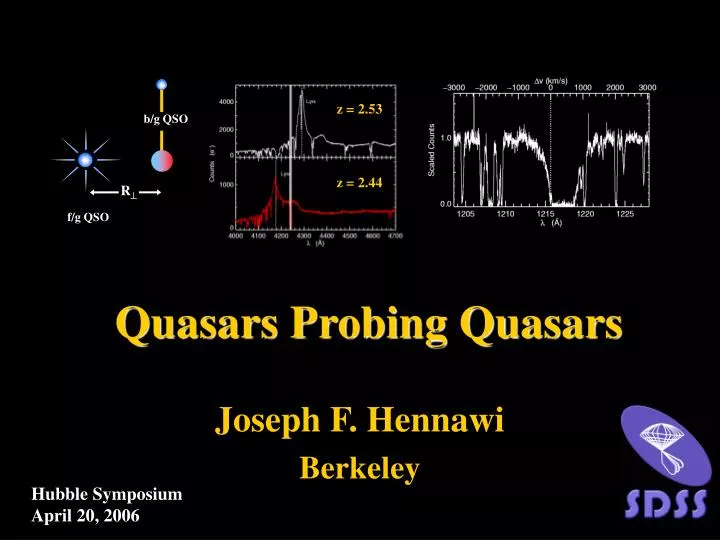
Quasars Probing Quasars. z = 2.53. b/g QSO. z = 2.44. R . f/g QSO. Joseph F. Hennawi Berkeley. Hubble Symposium April 20, 2006. Suspects. Scott Burles (MIT). Michael Strauss (Princeton). Jason Prochaska (UCSC). Outline. Primer on quasar absorption lines Proximity effects

E N D
Quasars Probing Quasars z = 2.53 b/g QSO z = 2.44 R f/g QSO Joseph F. Hennawi Berkeley Hubble Symposium April 20, 2006
Suspects Scott Burles (MIT) Michael Strauss (Princeton) Jason Prochaska (UCSC)
Outline • Primer on quasar absorption lines • Proximity effects • Fluorescent Ly Emission • Anisotropic clustering of absorbers around quasars • Shedding light on DLAs
Lyman Limit z = 2.96 Ly z = 2.96 Ly z = 2.58 LLS DLA (HST/STIS) DLA LLS ? Moller et al. (2003) Nobody et al. (200?) Quasar Absorption Lines • Ly Forest • Optically thin diffuse IGM • / ~ 1-10; 1014 < NHI < 1017.2 • well studied for R > 1 Mpc/h • Lyman Limit Systems (LLSs) • Optically thick 912 > 1 • 1017.2 < NHI < 1020.3 • almost totally unexplored • Damped Ly Systems (DLAs) • NHI > 1020.3 comparable to disks • sub-L galaxies? • Dominate HI content of Universe QSO z = 3.0
Self Shielding: A Local Example Average HI of Andromeda bump due to M33 LLS Ly forest M33 VLA 21cm map M31 (Andromeda) Braun & Thilker (2004) DLA Sharp edges of galaxy disks set by ionization equilibrium with the UV background. HI is ‘self-shielded’ from extragalactic UV photons. What if the MBH = 3107 Mblack hole at Andromeda’s center started accreting at the Eddington limit? What would M33 look like then?
Ionized Gas Proximity Effects Isolated QSO Projected QSO Pair Neutral Gas • Proximity Effect Decrease in Ly forest absorption due to large ionizing flux near a quasar • Transverse Proximity Effect Decrease in absorption in background QSO spectrum due to transverse ionizing flux of a foreground quasar • Geometry of quasar radiation field (obscuration?) • Quasar lifetime/variability • Measure distribution of HI in quasar environments Are there similar effects for optically thick absorbers?
Cosmology with Quasar Pairs = 5.4”, z = 2.05; Beam =86-99 kpc/h Close Quasar Pair Survey • Discovered ~ 100 sub-Mpc pairs (z > 2) • Factor 20 increase in number known • ~ 30 systems with beam < 100 kpc/h • Moderate Resolution Spectra Keck Gemini-N MMT • Near-IR Foreground QSO Redshifts Gemini N-S Science Goals • Small scale structure of Ly forest • Transverse proximity effects • Constrain dark energy from AP test Spectrum from Keck LRIS-B
Fluorescent Emission Shielded HI 912 ~ 1 in self shielding skin UV Background v dist of cloud P(v) Only Ly photons in tail can escape Zheng & Miralda-Escude (2005) • In ionization equilibrium ~ 60% of recombinations yield a Ly photon • Since 1216 > 104 912 , Ly photons must ‘scatter’ out of the cloud • Photons only escape from tails of velocity distribution where Ly is small • LLSs ‘reflect’ ~ 60% of UV radiation in a fluorescent double peaked line
Imaging Optically Thick Absorbers Column Density Ly Surface Brightness Cantalupo et al. (2005) • Expected surface brightness: • Still not detected. Even after 60h integrations on 10m telescopes! or Sounds pretty hard!
Help From a Nearby Quasar Background QSO spectrum 2-d Spectrum of Background Quasar 5700 UV background! Wavelength DLA trough r = 15.7! extended emission Spatial Along Slit (”) Adelberger et al. (2006) Doubled Peaked Resonant Profile?
I should spend less time at Keck, and more time in Vegas $$ Chuck Steidel Why Did Chuck Get So Lucky? b/g QSO • Surface brightness consistent with expectation for R|| = 0 • R|| constrained to be very small, otherwise fluorescence would be way too dim. DLA must be in this region to see emission f/g QSO R|| R = 280 kpc/h If we assume emission was detected at (S/N) = 10, then (S/N) > 1 requires: R|| < R [(S/N) -1]1/2 = 830 kpc/h or dz < 0.004 Since dN/dz(DLAs) = 0.2, then the probability PChuck = 1/1000! Perhaps DLAs are strongly clustered around quasars?
Absorbers Near Quasars = 13”, R= 78 kpc/h, gUV = 630 = 16”, R= 97 kpc/h, gUV = 365 = 23”, R= 139 kpc/h, gUV = 420 z = 2.17 z = 2.53 z = 2.07 DLA: NHI = 1020.3 cm-2 z = 1.98 z = 2.11 z = 2.44 LLS: NHI = 1019.7 cm-2 LLS: NHI = 1019 cm-2 Hennawi, Prochaska, et al. (2006)
Absorption probability for LOS as predicted by transverse clustering DLAs from Russell et al. (2006) No clustering Anisotropic Clustering Hennawi, Prochaska et al. (2006); Hennawi & Prochaska (2006a) Enhancement over UVB Chuck’s object • 29 new QSO-LLSs with R < 2 Mpc/h • High covering factor for R < 100 kpc/h • Assuming T(r) = (r/rT)- and = 1.6, rT = 9 1.7 (2.9 QSO-LBG) z (redshift) = SDSS = Keck = Gemini Transverse clustering predicts every QSO should have an absorber along the LOS = has absorber = no absorber
Proximity Effects: Open Questions • There is a LOS proximity effect but not a transverse one. • Measured T(r) gives, PChuck = 1/60. • Fluorescent emission proves Chuck’s DLA was illuminated. • Clustering anisotropy suggests most systems may not be. • Two possible sources of clustering anisotropy: • QSO ionizing photons are obscured (beamed?) • QSOs vary significantly on timescales shorter than crossing time: tcross ~ 4 105 yr at = 20” (120 kpc/h). Current best limit: tQSO > 104 • Can we measure the average opening angle? • Yes, but it requires a model for absorbers and QSO-HI clustering. • Much easier for optically thin transverse effect (coming soon). • Does high covering factor conflict with obscured fractions (~ 30%) of luminous QSOs? • Where are the metals from evaporated DLAs/LLSs near QSOs?
Cloud survives provided Otherwise it is photoevaporated Bertoldi (1989), Bertoldi & Mckee (1989) ‘Typical’ numbers for DLA: NHI = 1020.3 cm-2 and r ~ 5 kpc nH ~ 0.01 cm-3 ionization parameter Survival requires nH > 9 cm-3 r < 11 pc. But Chuck’s fluorescence was resolved in 0.5” seeing r ~ 4 kpc? Two phase medium? Is a disk shielding the galactic halo? Hennawi & Prochaska (2006a) Shedding Light on DLAs QSO is to DLA . . . as . . . O-star is to interstellar cloud gUV = 5700 b/g QSO f/g QSO R = 280 kpc/h
Got Fluorescence? Hennawi & Prochaska (2006b) PSF subtracted 2-d spectrum • gUV = 7900 UVB expect (Chuck’s gUV = 5700) • Two other similar systems show no fluorescence • ‘Odd’ HI profiles? Unresolved emission? b/g QSO 2-d spectrum f/g QSO = 6.2”, R= 37 kpc/h background QSO spectrum 3.5 hour integration on Gemini LLS: NHI = 1018.85 cm-2
Summary: Quasars Probing Quasars • QSO-absorber pairs probe anisotropy of luminous QSO emission at z > 2. • With fluorescents emission, LLSs act as mirrors giving us another view of high redshift QSOs. • New measure of the clustering of faint galaxies around quasars. • New laboratories to study fluorescent emission. LLSs illuminated by quasars are as bright as • Detection of fluorescence constrains quasar lifetime, tQSO > tcross , for individual QSOs! • New opportunities to study the distribution of HI in high-z proto-galaxies subject to extreme UV radiation.
Quantifying Absorber Clustering Transverse Cosmic Average Line of Sight b/g QSO isolated QSO cutoff • dN/dz only constrains product of number density and cross section. • Size does not matter for transverse. It does matter for line of sight. • Only rare close pairs probe small scales for transverse. • Every isolated line of sight probes small scales. f/g QSO z Far from a QSO z z r R
pair • Measure ‘Jeans Mass’ of Ly clouds thermal history of IGM FWHM Perfect 20 km/s 40 km/s 80 km/s 160 km/s Ability of single pair to distinguish DE = 0.7 from DE = 0.8 1 pair at S/N=20 (courtesy of Pat McDonald) Close Pairs and the Ly Forest quasar Neutral Gas Goal: Measure transverse Ly correlations of close pairs with z > 2 Science: • Extend power spectrum measurements to small scales • Probe DE at z ~ 2 with the Alcock - Paczynski test
Small Scale Power at z = 2 = 5.4” z = 2.05, 2.09 Beam =86-99 kpc/h (comoving)
Common Absorbers Small Scale Power at z = 3 = 13.8” z = 3.0 Beam =274-306 kpc/h (comoving)
Tomography with Quasar Groups z = 1.8 z = 2.08 z = 2.39 z = 2.17 8’ z = 2.6 Keck LRIS mask 5’