Download
1 / 13
130 likes | 299 Views
QIPP National Urgent Care Clinical Dashboard. “From the outset it has been clear that the dashboard is a powerful tool to help clinicians understand

E N D
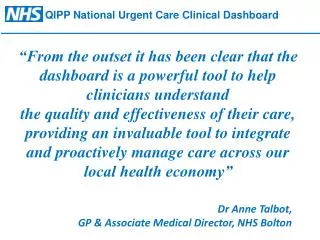
QIPP National Urgent Care Clinical Dashboard “From the outset it has been clear that the dashboard is a powerful tool to help clinicians understand the quality and effectiveness of their care, providing an invaluable tool to integrate and proactively manage care across our local health economy” Dr Anne Talbot, GP & Associate Medical Director, NHS Bolton
NHS Bolton Urgent Care Dashboard • Provides “real-time” information from local Acute Trust on A&E attendances, admissions and discharges combined with “real-time” information from Out of Hours and the Walk in Centre to each GP Practice. • Displayed in a graphical, user-friendly way to help Practices to more pro-actively manage and co-ordinate patient’s healthcare, especially for the most vulnerable patients and those with long-term conditions. • Doesn’t contain any more information than the Practice already receives, but presents the information in a timely way, displaying all of information together to present a more complete picture.
Integration of information from multiple source systems Information From Acute Trust Walk in CentrePatient Attendance DatePatientM 01/02/2009 PatientF 01/02/2009 PatientJ 02/02/2009 PatientM 03/02/2009PatientJ 04/02/2009 A&E AttendancesPatient Attendance DatePatientA 01/02/2009 PatientF 01/02/2009 PatientJ 02/02/2009 PatientM 03/02/2009PatientJ 04/02/2009 PatientK 03/02/2009 Information received separately from multiple sources within different time frames – making identifying patterns difficult PatientK 03/02/2009 PatientK 08/02/2009 Out Of HoursPatient Contact DatePatientT 01/02/2009 PatientY 01/02/2009 PatientJ 02/02/2009 PatientM 03/02/2009PatientJ 04/02/2009 AdmissionsPatient Admission DatePatientA 01/02/2009 PatientH 04/02/2009 PatientK 08/02/2009 PatientK 02/02/2009 DischargesPatient Discharge DatePatientA 08/02/2009 Information From Practice PatientK 08/02/2009 Practice Disease RegisterPatient RegisterPatientT Diabetes PatientS CHD PatientK COPD Current Position
Integration of information: simple working example Information From Acute Trust Patient Attendance DatePatientM 01/02/2009 PatientF 01/02/2009 PatientJ 02/02/2009 PatientM 03/02/2009PatientJ 04/02/2009 WiC WiC Patient Attendance DatePatientA 01/02/2009 PatientF 01/02/2009 PatientJ 02/02/2009 PatientM 03/02/2009PatientJ 04/02/2009 A&E A&E A&E Clinical Dashboard:Patient Drilldown - PatientK PatientK 03/02/2009 PatientK 02/02/2009 PatientK 08/02/2009 Patient Contact DatePatientT 01/02/2009 PatientY 01/02/2009 PatientJ 02/02/2009 PatientM 03/02/2009PatientJ 04/02/2009 COPD OOH OOH Patient Admission DatePatientA 01/02/2009 PatientH 04/02/2009 Admission Admission COPD COPD PatientK 03/02/2009 PatientK 08/02/2009 COPD COPD Discharge Discharge Information From Practice Patient Discharge DatePatientA 08/02/2009 COPD Practice Disease RegisterPatient RegisterPatientT Diabetes PatientS CHD PatientK 08/02/2009 PatientK COPD
Dashboard interface Enables GPs, nurses and active case managers to monitor their own patients' recent attendances at A&E and out-of-hours services, and to highlight which of these patients are on disease registers.
1st stage patient level drill down GPs, nurses and active case managers are able to access individual patient information including the care setting the patient presented at, frequency of contact and whether the patients is on a disease registers. This information can highlight issues with the local delivery of care for specific types of disease management, providing pointers about where to focus local improvement efforts most effectively
2nd stage patient level drill down Enables GPs, nurses and active case managers to see a more granular level of patient information including the symptoms the patient presented with and the outcomes. Such information can greatly assist pro-active clinical intervention for patients with multiple presentations to unscheduled care settings. In particular, this level of information can help GPs and other healthcare staff to identify those patients in need of detailed Primary Care assessments, to then review existing management plans, and to establish new levels of care or assistance where this is needed.
Identifying patients regularly accessing unscheduled care services This report shows urgent contacts, sorted in order by highest number of contacts. This enables practices to identify and focus on those patients that are regularly accessing unscheduled services.
Benefits and levels of use • Quality Benefits • Improved awareness about practice patients attending unscheduled care services, enabled GPs and Practice Healthcare staff to proactively and better manage vulnerable patients and those ‘just below the clinical radar’ • The dashboard was used as an enabler and integrated alongside related initiatives to better channelling patient pathways and improving patient experience • Efficiency Benefits • Within the first pilot practices in Bolton, one practice reduced their A&E attendance by 16.8%, compared to an increase of 3.85% in their peer practices. A second practice reduced their non-elective admissions in targeted areas of asthma, COPD, diabetes, falls and heart failure by 20.69%. • Use of the dashboard combined with wider ‘joined-up’ initiatives and excellent clinical engagement across the PCT helped led to significant reductions in A&E attendances and non-elective admissions.
QIPP National Urgent Care Clinical Dashboard The Urgent Care Dashboard is now part of the QIPP Urgent Care workstream led by Sir John Oldham. • High level aim - to make the Urgent Care Clinical dashboard (based on the NHS Bolton dashboard) available to all PCTs /GP Consortia across England over the next 2 years, starting with 12 locally led pioneer sites.
QIPP Urgent Care dashboard - Pioneer Sites South Cheshire and Vale Royal GP Commissioning Consortiums NHS Central Lancashire NHS Tees NE Lincolnshire Care Trust Plus / NHS North Lincolnshire / North Lincolnshire & Goole Hospitals NHS Foundation Trust NHS Northamptonshire NHS Stoke on Trent and NHS North Staffordshire NHS Cambridgeshire NHS Devon Central London Healthcare Pathfinder GP Consortium Newham Health Partnership / Newham Commissioning Group NHS Oxfordshire NHS Brighton and Hove
QIPP National Urgent Care Clinical Dashboard • Wider objectives • Inform the strategy and approach to the wider ‘local’ take-up of the Urgent Care dashboard • Development of Local SHA/PCT Cluster/GP Consortia capability to become self-sufficient in supporting local deployment • To create a toolkit to support wider take-up of the Urgent Care dashboard including Standards, Logical architecture, data feeds library, detailed design documentation, project management artifacts and updates to metrics repository
Further information & contact ResourcesNHS Networks - http://www.networks.nhs.uk/nhs-networks/qipp-urgent-care-gp-dashboardFurther informationBackground Information http://www.dh.gov.uk/en/Publicationsandstatistics/Bulletins/Medicaldirectorsbulletin/DH_122289 DH QIPPhttp://www.dh.gov.uk/en/Healthcare/Qualityandproductivity/QIPP/index.htm NHS Institute for Innovation and Improvement http://www.institute.nhs.uk/cost_and_quality/qipp/cost_and_quality_homepage.html NHS Evidence http://www.evidence.nhs.uk/qualityandproductivity Details relating to National Pilot (including case studies and toolkit)http://www.cfh.nhs.uk/clindash Contacts Team Mailbox – clinical.dashboard@nhs.net