Download

1 / 30
300 likes | 426 Views
Integrated policies for energy and economy. Mark Barrett Mark.Barrett@ucl.ac.uk UCL Energy Institute. GREEN GROWTH: SMART POLICIES – SMART TECHNOLOGIES’’ Prague, 21st October 2010, National Technical Library, Technická 6, Prague. Basic argument. Context :

E N D
Integrated policies for energy and economy Mark Barrett Mark.Barrett@ucl.ac.uk UCL Energy Institute GREEN GROWTH: SMART POLICIES – SMART TECHNOLOGIES’’Prague, 21st October 2010, National Technical Library, Technická 6, Prague
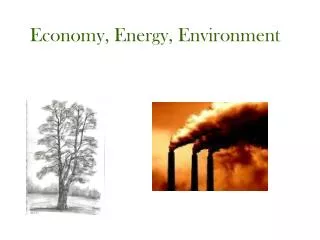
Basic argument Context: • Growth in the demand for energy services • Depleting finite fossil and fissile energy resources • Environmental threats; climate change, other pollution Consequences with business as usual: • Energy security undermined • Economy inefficient and vulnerable to energy price fluctuations • Environmental impacts with high social and economic cost Policy responses: • Review of consumption • Energy efficiency • Renewables Result of new policy: • Sustainable society and efficient economy
OBJECTIVES OF STRATEGY SOCIAL, ECONOMIC, POLITICAL • Meet objectives at least cost with social equity • Avoid irreversible, risky technologies ENERGY SECURITY • Reduce dependence on finite fossil and nuclear fuels • UK 20% of energy from renewables by 2020 => ~35% renewable electricity? • renewable transport fuels: 5% of by 2010, 10% by 2020 ENVIRONMENT UK • Government targets for GHG reduction from 1990: 12-20% by 2010, ~30% by 2020, 60-80% 1990-2050, including international transport. • Require >95% GHG reduction for climate control and global equity Europe • 20/30% GHG reduction 1990-2020
Ethics: equal CO2 emission per person? Humans have equal rights to emissions, therefore convergence of emission per person in the EU and elsewhere? What about different resources and climate of countries? Note that for global equity, EU per capita emissions will have to fall by over 95% to reach 60% reduction globally.
EU Scenarios Six scenarios for each EU25 country were constructed to reach these objectives using different combinations of NEOP measures implemented to different degrees.
Exogenous assumptions (from PRIMES WCLP scenario): basic drivers Population peaks and declines More households GDP growth
UK dwellings scenario (illustration) Stock projection Slow demolition rate, so refurbish. Cohort space heat loss Space heat in 2050 dominated by current buildings
SEEScen sample: Transport: passenger vehicle distance Demand management and modal shift can produce a large reduction in road traffic reduces congestion which gives benefits of less energy, pollution and travel time. Assumed introduction of electric vehicles to replace liquid fuels, and reduce urban air pollution.
Cars: carbon emission by performance Car carbon emissions are strongly related to top speed, acceleration and weight. Most cars sold can exceed the maximum legal speed limit by a large margin. Switching to small cars would reduce car carbon emissions by some 50% in 15 years in the UK (about 7% of total UK emission). Switching to micro cars and the best liquid fuelled cars would reduce emissions by 80% and more in the longer term. In general, for a given technology, the emissions of pollutants are roughly related to fuel use, so the emission of these would decrease by a similar fraction to CO2.
Energy economics: chaotic rising fuel prices Gas Oil Europe industrial electricity prices Coal
Energy economics - scenario High carbon High fuel prices Large fraction of cost Low energy Low carbon Lower fuel cost More predictable
Energy economics Low carbon Lower cost?
SEEScen sample: EU25 CO2 emissions by country : EU30pc20N scenario . The black squares show the targets for 2010 and a 30% reduction by 2020.
SEEScen sample: EU25 CO2 : variant scenarios 40% reduction New nuclear Maximum behaviour No new nuclear Maximum technology No new nuclear Maximum technology and behaviour No new nuclear
SEEScen sample: Energy security EU25 energy trade : including fuels for international transport: EU30pc20N scenario
Air pollution : emissions and reduction costs The EU30N energy scenario results in lower emissions and control costs for all pollutants than in the EUV scenario.
InterEnergy – trade optimisation animated This shows InterEnergy seeking a least cost solution. It illustrates how patterns of electricity flow might change. An increase in renewable electricity will require a higher capacity grid with more sophisticated control
Conclusions: 1 Demand • Large energy demand reduction feasible with technologies in all sectors, but smaller reductions in road freight transport, aviation and shipping. • Behavioural change very important, especially in car choice and use, and air travel. Supply • A shift from fossil fuel heating to solar and electric heat pumps • A shift from fossil electricity generation to a mix of renewables • Large renewable electricity potential and Europe might become a net exporter of electricity • but remain a large importer of oil • Renewable energy fraction difficult to define. • Main problem is replacing fossil liquid transport fuels, especially for aircraft and ships
Conclusions: 2 • Large CO2 reductions possible • Date and rate of introduction of measures critical. • Low carbon scenarios have a lower total and air pollution control cost than high carbon scenarios • Demand reduction and renewables address all problems simultaneously
Positive prospects • Vast domestic and foreign markets for efficiency and renewables in a world with 7 billion people. • Require a range of labour skills for technology production and installation. • Efficiency and renewable markets are sustainable, unlike those based on finite energy sources. Energy efficiency: • Technologies: insulation, ventilation control, appliances, heat pumps, vehicles, CHP • Installation: buildings, transport, industry, supply For example: building energy-efficiency investment US$ 300 billion annually would reduce building energy use and carbon by ~52% with paybacks 5-10years. (WBCSD, 2009)
World building needs Ageing population everywhere Less developed regions • Population growth about 3 billion (40%) percent to 2050 • number of households will grow by about 1.6 billion (80 %) - decreasing household size a factor. • Rapid urbanisation. China +0.4 billion more urban dwellers in 20 years; India, similar trend Developed regions • nearly static
Positive prospects - supply • Electricity. EU more wind installation than any other generation. Huge markets developing in China http://www.ewea.org/fileadmin/ewea_documents/documents/statistics/general_stats_2009.pdf • And globally…. Source: EIA, IEA, Bloomberg New Energy Finance, REN21, UNEP SEFI Note: *Excluding large hydro. Renewable capacity figures based on known commissioned projects logged on the Bloomberg New Energy Finance desktop
IMPLEMENTATION UK: changes Buildings: • 25 M houses to refurbish, 10 M new build Transport: • Demand management • National – 20 M (?) electric vehicles, infrastructure • Long distance / international rail Electricity: • Demand reduction ~50% • Generation: UK ~100 GW of renewable capacity • Transmission, and load management
IMPLEMENTATION: social capacity Labour: skills and workers to: • Build electric vehicles, wind turbines etc. • Refurbish buildings Require mix of : • public sector planning and investment • market structures for private sector Requires international cooperation
Barriers and policies Fundamental barriers: • Dominance of (mainly fossil/fissile) energy supply oligopolies who profit by volume of energy sales. • Weakness of consumers and new supply entrants in terms of market power, information, financing etc. Policy instruments • Regulatory • Market. • Public investment There are practicable policies as demonstrated by countries with high levels of efficiency (consumption and CHP etc.) and renewables, particularly in Scandinavia.
SUMMARY OF STRATEGY A renewable and reversible strategy minimising intergenerational waste burdens; no new nuclear power and negligible fossil carbon capture and sequestration (CCS). • 50-80% reduction in energy demand with behavioural and technical measures • Increase conversion efficiency in boilers, motors, heat pumps, and cogeneration • Increase renewable energy. How best to use biomass - in CHP? • Renewable heat is supplied to the stationary sectors either on site with solar energy, or via renewable electricity driven heat pumps. • Renewable electricity replaces transport oil where possible via electricity to trains and electric vehicles. Some known unknowns • Long distance transport. How to replace kerosene in aircraft and oil in ships? Technical and political problem replacing liquid fossil fuels in aviation and shipping means emission reductions approaching 100% in the stationary sectors. • Will social capacity and instruments be available to implement measures fast enough?
References UNFCCC (2008), Investment and Financial Flows to Address Climate Change: an update. Techncial paper FCCC/TP/2008/7. UNFCCC. http://unfccc.int/resource/docs/2008/tp/07.pdf UNEP/SEFI Bloomberg, 2010, Global Trends in Sustainable Energy Investment 2010: Analysis of Trends and Issues in the Financing of Renewable Energy and Energy Efficiency. http://sefi.unep.org/fileadmin/media/sefi/docs/publications/UNEP_GTR_2010.pdf World Business Council for Sustainable Development (WBCSD), 2009, Energy Efficiency in Buildings; Transforming the Market. http://www.wbcsd.org/DocRoot/rVDgBRKvPngUrqivMHNM/91719_EEBReport_WEB.pdf Renewables. http://www.un.org/esa/sustdev/sdissues/energy/op/beijing_re_egm/beijing_re_report.pdf
References: Barrett GENERAL: http://www.bartlett.ucl.ac.uk/markbarrett/Index.htmlhttp://www.bartlett.ucl.ac.uk/markbarrett/Teaching/Educ.html CONSUMPTION: Report on consumption, energy and carbon dioxide including behavioural measures. http://www.bartlett.ucl.ac.uk/markbarrett/Consumption/EneCarbCons05.zip SCENARIOS Barrett M, December 2007, Low Emission Energy Scenarios for the European Union, report 5785. ISBN 91-620-5785-5, ISSN 0282-7298. http://www.naturvardsverket.se/Documents/bokhandeln/620-5785-5.htm Naturvårdsverket (Swedish environmental protection agency, SE-106 48 Stockholm www.naturvardsverket.se TRANSPORT Consultancy to DfT on project. Carbon Pathways: Analysis Informing Development of a Carbon Reduction Strategy for the Transport Sector, July 2008 .http://www.dft.gov.uk/pgr/sustainable/analysis.pdf Overview of some aspects of sustainable transport : http://www.bartlett.ucl.ac.uk/markbarrett/Transport/TransportSus_MBarrett_020608.ppt Aviation: Technical scenarios http://www.bartlett.ucl.ac.uk/markbarrett/Transport/Air/Aviation94.zip Effects of charges: http://www.bartlett.ucl.ac.uk/markbarrett/Transport/Air/AvCharge.zip ELECTRICITY: Feasibility of a high renewable electricity system Barrett, M. 2007, A Renewable Electricity System for the UK. In Renewable Energy and the Grid: The Challenge of Variability, Boyle, G., London: Earthscan. ISBN-13: 978-1-84407-418-1 (hardback). http://www.cbes.ucl.ac.uk/projects/energyreview/Bartlett%20Response%20to%20Energy%20Review%20-%20electricity.pdf http://www.bartlett.ucl.ac.uk/markbarrett/Energy/UKEnergy/UKElectricityGreenLight_100506.ppt HEALTH Barrett M, Holland M, April 2008, The Costs and Health Benefits of Reducing Emissions from Power Stations in Europe. Published by the Air Pollution and Climate Secretariat and the European Environmental Bureau. ISBN: 978-91-975883-2-4 ISSN: 1400-4909. http://www.airclim.org/reports/APC20_final.pdf