Download
1 / 101
1.02k likes | 1.26k Views
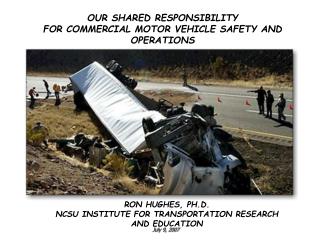
OUR SHARED RESPONSIBILITY FOR COMMERCIAL MOTOR VEHICLE SAFETY AND OPERATIONS. RON HUGHES, PH.D. NCSU INSTITUTE FOR TRANSPORTATION RESEARCH AND EDUCATION. July 9, 2007. OUR SHARED RESPONSIBILITY FOR COMMERCIAL MOTOR VEHICLE SAFETY AND OPERATIONS. RON HUGHES, PH.D.

E N D
OUR SHARED RESPONSIBILITY FOR COMMERCIAL MOTOR VEHICLE SAFETY AND OPERATIONS RON HUGHES, PH.D. NCSU INSTITUTE FOR TRANSPORTATION RESEARCH AND EDUCATION July 9, 2007
OUR SHARED RESPONSIBILITY FOR COMMERCIAL MOTOR VEHICLE SAFETY AND OPERATIONS RON HUGHES, PH.D. NCSU INSTITUTE FOR TRANSPORTATION RESEARCH AND EDUCATION July 9, 2007
OUR SHARED RESPONSIBILITY FOR COMMERCIAL MOTOR VEHICLE SAFETY AND OPERATIONS RON HUGHES, PH.D. NCSU INSTITUTE FOR TRANSPORTATION RESEARCH AND EDUCATION July 9, 2007
We have a shared responsibility to reduce truck-involved crashes
Which may be further characterized by these types of cargo body types
All having in common. . . a GVWR of 10,001 lbs or above
North Carolina’s Performance FMCSA 2008 Goal (1.65 fatalities/100MTMT) FMCSA Strategic 2008 Goal (1.65 fatalities per 100MTMT)
CY2006 CMV-INVOLVED CRASHES BY INJURY SEVERITY Data are from NCDOT Traffic Engineering Accident Analysis System (TEAAS)
Top Ten States in Estimated Annual Truck Miles Traveled (Rank Based on 2005) Top Ten States in Number of CMV-Involved Fatalities (Rank Based on 2004) 2001 2002 2004 2005 2003 2001 2002 2003 2004 Texas 486 467 487 468 California 20077 20268 21172 21370 21706 California 378 362 370 415 Texas 19450 19108 18775 19609 20052 Florida 365 376 365 377 Florida 10197 10018 11836 12437 13531 Georgia 255 198 232 248 Georgia 8202 9667 9448 9551 9819 North Carolina 201 169 162 198 Ohio 9556 9317 9209 9192 9688 Ohio 168 203 151 190 Illinois 8442 8287 8583 8859 9141 Pennsylvania 185 174 224 189 Pennsylvania 8848 8724 8621 8822 8913 North Carolina 7454 7407 7380 7503 7753 Alabama 145 128 147 163 Illinois 200 156 194 158 Indiana 7393 7391 7087 7239 7327 Missouri 139 154 167 158 New York 7030 6926 6789 6984 7221 BOTTOM LINE: CMV-involved fatalities differ between states largely in terms of exposure (truck miles traveled). ‘Risk’ x ‘Exposure’ = crash frequency. Is the ‘risk’ of fatal CMV crashes higher in these states or the degree to which they are ‘exposed’ to similar risks? Is NC Really ‘That Bad’?
Weekday Peak-Period Congestion Has Grown in Several Ways in the Past 20 Years in Our Largest Cities Source: Traffic Congestion and Reliability: Trends and Advanced Strategies for Congestion Mitigation (FHWA Office of Operations)
RATE IN CHARLOTTE RATE IN COMPARABLE US CITIES Growth in Total Delay In the past year, a poll cited traffic congestion as the No. 1 problem in the greater Charlotte region, and a study found that congestion in North Carolina will more than double in the next 25 years. Traffic delays in Charlotte will mirror those currently seen in Chicago . . . (eTrucker.com, June 2007) RATE IN CHARLOTTE Source: 2005 Annual Urban Mobility Report (FHWA and TTI)
Did you know? • Commercial truck travel doubled over the past two decades. Freight tonnage estimated to double by 2020, with major portion carried by truck at some point in chain. Source: 2006 Status of the Nation's Highways, Bridges, and Transit:Conditions and Performance (FHWA)
Did you know? • Commercial truck travel doubled over the past two decades. Freight tonnage estimated to double by 2020, with major portion carried by truck at some point in chain. • On 20 percent of the Interstate Highway System, trucks account for more than 30 percent of all vehicles. Source: 2006 Status of the Nation's Highways, Bridges, and Transit:Conditions and Performance (FHWA)
Did you know? • Commercial truck travel doubled over the past two decades. Freight tonnage estimated to double by 2020, with major portion carried by truck at some point in chain. • On 20 percent of the Interstate Highway System, trucks account for more than 30 percent of all vehicles. • The growth in truck travel has been exceeding the growth in passenger travel over time, suggesting that the percentage of trucks in the traffic stream is likely to grow substantially if current trends continue. Source: 2006 Status of the Nation's Highways, Bridges, and Transit:Conditions and Performance (FHWA)
Did you know? • Because of their size and operating characteristics, trucks have a greater effect than personal vehicles on traffic flow and highway level of service. Trucks take up more physical space on the roadway and do not accelerate, brake, or maneuver as well as passenger vehicles. • Trucks contribute significantly to congestion in urban centers. Source: 2006 Status of the Nation's Highways, Bridges, and Transit:Conditions and Performance (FHWA)
MAJOR BOTTLENECKS Charlotte Did you know? • Trucks account for at least one-fifth of the delay for all vehicles in the 50 worst urban bottlenecks in the Nation (2004 FHWA report, Traffic Congestion and Reliability: Linking Solutions to Problems) Source: 2006 Status of the Nation's Highways, Bridges, and Transit:Conditions and Performance (FHWA)
On city streets in crowded business districts . . . pickup and delivery vehicles cause nearly a million hours of vehicle delay each year to other traffic as they stop to serve office buildings and retail establishments (Oak Ridge National Laboratory, in its 2004 study, Temporary Losses of Highway Capacity and Impacts on Performance: Phase 2) Did you know? Source: 2006 Status of the Nation's Highways, Bridges, and Transit:Conditions and Performance (FHWA)
With respect to truck safety . . . Two On-Line Tools to Track CMV Crashes in NC
Click Here
Zoom Zoom to