Download
1 / 46
460 likes | 774 Views
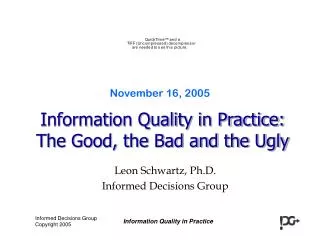
Information Quality in Practice: The Good, the Bad and the Ugly. November 16, 2005. Leon Schwartz, Ph.D. Informed Decisions Group. What Me Worry?. Business Champions for TDQM Programs are scarce , because Data Quality is difficult to define & measure,

E N D
Information Quality in Practice: The Good, the Bad and the Ugly November 16, 2005 Leon Schwartz, Ph.D. Informed Decisions Group
What Me Worry? Business Champions for TDQM Programs are scarce, because Data Quality is difficult to define & measure, even though Poor Data Quality costs Billions of dollars.
Information Quality in Practice • Prolog: Poor Data Costs $Billions • The Good: You Can Clean it Up • The Bad: The Cost of Avoidance • The Ugly: The Pogo Effect • Epilogue: What is Data Quality, anyway?
Poor Data Quality Costs $Billions • Data quality problems cost U.S. businesses $611 billion a year. • 40% of firms have suffered losses. • 2% of customer records are obsolete in one month. • Customer duplication rates range 5 to 20%. • The Web is increasing data entry errors. Source: Data Warehouse Institute Study, 2002
Effects of Bad Customer Data • Low credibility among customers & suppliers • Poor decision making • Lost customers/clients • Unnecessary printing & postage • Poor customer service • Lost business opportunities • Inefficient utilization of staff
Data Affects Your Success Relative influence of P eople rocess olitics DATA A lgorithm on an OR/MS project
Room for Improvement • Only 11% have implemented a DQ program* • 48% have no plan for a program • 26% purchased a data quality tool* • 52% have no plans • Still very far from 6 Sigma! • Easy to improve Quality, if….. *Source: Data Warehouse Institute Study, 2002
…..You Can Answer the Following • How good is good enough? • How often is often enough? • How much is it worth? Information must be Useful
Information Quality in Practice • Prolog: Poor Data costs $billions • The Good: You can Clean it up • The Bad: The Cost of Avoidance • The Ugly: The Pogo Effect • Epilogue: What is Data Quality, anyway?
Data Quality Starts with Access • Data does not exist anywhere • Exists, but you can’t find it • You found it, but you can’t get to it • You can get to it, but you don’t have authority to use it • You can use it, but it is a total MESS “I never realized HOW BAD!” • Data Warehouse NIRVANA! It’s dirty, but useful. CDI
Data Quality & the Data Warehouse “I never realized HOW BAD our data is!” Integrating data can improve Quality, if you… • Quality Control the Match • Measure & Improve Integrity • Flag “out of range” Values • Manually examine BIG “leftovers” • Audit a random sample of Customers
Matching Improves Quality • Group ID • Account ID • Account ID • Duns Name Address • Operations • Cleanse • Transform • Consolidate Phone Rules
Establish Q. A. Procedures • Use a common sample • Establish replicable process • Document carefully • Realize the subjectivity • Train the Vendor • Audit the Vendor
Document Integrity Rules and UPDATE
Looking at counts saves the day Flag “out of range” Values
Begins and ends with the CUSTOMER Ensuring Data Quality • Focus on the PROCESS (TQM) • Define Quality Metrics (KPIs) • Use Data Cleansing Tools • NCOA • Type “data cleansing” in Google for list • Document everything • Audit regularly • Test, test, test • Who is using? How?
Information Quality in Practice • Prolog: Poor Data costs $billions • The Good: You can Clean it up • The Bad: The Cost of Avoidance • The Ugly: The Pogo Effect • Epilogue: What is Data Quality, anyway?
Who’s Cleaning Up? CDI • Data Quality Software Vendors • IBM (acquired Ascential who acquired Vality) • SAS (acquired DataFlux) • Harte-Hanks (acquired Trillium) • Firstlogic, Unitech, Innovative Systems • Similarity Systems (ACQUIRED Evoke SW) • Address Matching & Cleansing Vendors • Pitney Bowes acquired Group 1 (4/05) and Firstlogic (???) • Plus 100s of service bureaus • Specialty houses • I.e., Comanage for telcomm companies ….and the data is still dirty.
Information Requirements are Relative • Strategic objectives or goals • Who are the clients (THEY) • What THEY need • When they need it • Where they need it • How they need it "...I'll know it when I see it."
Data Quality Programs are Rare Scope the Effort Data Discovery - Information Inventory - ”As-is” processes - Information Priorities • - Data Description • - Simple Data Checks • - Data Mining Develop DQ rules Categorize Data Defects - Integrity, retention, refresh, reliability - Classify defects & causes Define DQ Program Launch & Track - Metrics, KPIs
Dealing with DENIAL is Daunting • Expose shoddy business processes • Change business practices • Agree on common definitions, rules, roles • Train employees • Tackle political/cultural issues
Information Quality in Practice • Prolog: Poor Data costs $billions • The Good: You can Clean it up • The Bad: The Cost of Avoidance • The Ugly: The Pogo Effect • Epilogue: What is Data Quality, anyway?
Sources of Errors • Technical • Careless calculations • Poor programming • Process • Human error • Negligence • Intent (policy) • Political
KPI Target – level 1 Fix the Basics: Customer Master Cleanse 6.9 million root records Eliminate duplicate customer records (est x %) Eliminate inactive customer records (est x%) Reduce business processes creating incorrect Customer Information Populate and interface SAP Customer Master Customer Master live by Dec. 31, 2002 Target – level 3 Customer Master live by 1Q 03 Actual / Forecast • To-Be Business processes complete • Data quality activities • 1.6 MM obsolete identified and purged • 2.3 MM duplicates identified, 325K identified for elimination (Customers confirmed need for 1.95 MM duplicates, based upon current capabilities) • Cleansed 3.6 M U.S. records (via Finalist, Customer Contact) • D&B DUNS linkage in process. Identified 577 K duplicates, 2.9 M unique DUNS customers • Analyzed and Improving processes which create bad data • Identified and documented sources of create / update / delete to legacy customer records. • Removed change authorization from 2,940 employees, primarily Sales, Service, Product Supply, and PBCC New Business Operations • Identified and corrected 4 significant (and numerous minor) legacy systems problems creating incorrect and/or duplicate customer information • Conversion to SAP environment • Production environment complete • 34 interface and conversion development activities • Customer Master Live (Converted from IMS to SAP) on track for December 6 • User Training • User and Power user training developed • Power User Boot Camp training completed November 22 • End user training (1,300 users) scheduled for January
Avoiding Errors “This customer already is in our database.” • Technical • Error Trapping • CMM program • Process • Edit checks • Training • Streamlining • Political • Culture change
Unreliable Cancellation Data Creates a “Lose-Lose-Lose” • Suspect cancellations identified • Audit reports sent to field • VP, Sales fired • Customer Retention • Executive focus • The Pogo Effect • Fix the Basics • “Software enhancement” • Order to Cash • “All fixed for 2005”
Taking I.Q. to the Next Level • Merge/Purge/Address Hygiene no longer good enough • Move from Repair to Correct to Prevent • Organizational Change, Compromise and Accountability impact program budget • How to JUSTIFY $$ when I.Q. is so fuzzy??
Information Quality in Practice • Prolog: Poor Data costs $billions • The Good: You can Clean it up • The Bad: The Cost of Avoidance • The Ugly: The Pogo Effect • Epilogue: What is Data Quality, anyway?
It’s All About Perception • We’ve had this problem for 20 years. • We know we had this problem for 10 years • Every organization has the problem • We know it will cost to improve it • How much of an improvement can I buy? • What is the ROI? • Can I believe what you tell me? "...I'll know it when I see it."
Wang & Strong ID 179 I.Q. Attributes Ponniah defines 17 Redman defines 27 Marakas defines 11
Where to Start? • Too many definitions: no clarity • Need to focus! • Most include ACCURACY as one dimension • Even Accuracy is a fuzzy concept • What are ‘errors”? • What are “true” values? “false”? “suspect”? • Can we even measure accuracy “accurately”?
Even the Lexicon of Terms is Fuzzy Quality>>Accuracy>>Error-free • Direct observation of “errors” • Subjective • Unreliable • Impractical even with moderate size data sets • High cost • Automated error reports • Who creates the rules? • Needs to be audited • Misses subtleties • Lower cost A Major Research Challenge
You be the JUDGE Find the Errors
The 3 C’s Content Performance Preference Perception Functional Experience Analytical Context Cognition SME Aptitude
Thank you for your time Leon Schwartzwww.informeddecisionsgroup.com The Data Quality Perception Research Website http://www.xkimo.com/dqpresearch/
Research Design • Samples created with 0-15 errors (17% max) • Samples randomly presented (see website) • Practice session (6 samples) • Respondents asked to rate 16 samples on 1-30 scale (modified Magnitude Estimation) • Double anchors used • 63 students (grad & undergrad) attempted
The Simple Task Please examine the data/report above, and estimate the accuracy of the information by placing your cursor and clicking on the line below: Error Prone Error Free (Too many mistakes to be useful) (No discernable mistakes) Low Accuracy High Accuracy Anchor Study Fiasco!
The Perceptual Transfer Function 3 2 Perceived accuracy (subjective) 1 Number of errors (objective) Error rate (objective)