Download

1 / 47
470 likes | 622 Views
Chapter 8. The Work Sheet and Financial Statements. The Six-Column Work Shop. Purpose of the Work Sheet. A work sheet is an informal business paper used to organize and plan the information for the financial statements. This is a great application for a computerized spreadsheet program.

E N D
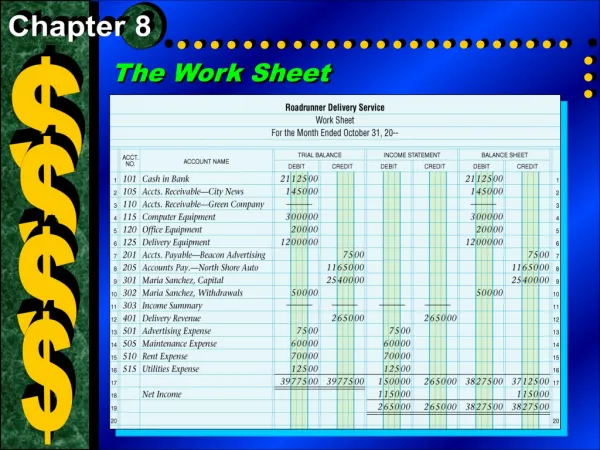
Chapter 8 The Work Sheet and Financial Statements
Purpose of the Work Sheet • A work sheet is an informal business paper used to organize and plan the information for the financial statements. • This is a great application for a computerized spreadsheet program. • In Chapter 9 we will expand the work sheet to eight columns, allowing for the adjustments required by certain GAAPs.
Control Accounts for Accounts Receivable and Accounts Payable • In the future, when we prepare a trial balance, or a work sheet, we will not display the debtors’ names or creditors’ names associated with Accounts Receivable and Accounts Payable. • Alternatively, we will use control accounts. • The Accounts Receivable control account represents the sum of the balances of all the individual Accounts Receivable accounts.
Control Accounts for Accounts Receivable and Accounts Payable • The Accounts Payable control account represents the sum of the balances of all the individual Accounts Payable accounts. • Having two control accounts, instead of dozens or hundreds of individual debtors’ and creditors’ accounts, streamlines the work sheet. • The details about the accounts of individual debtors and creditors are kept in separate records. This will be covered in more detail in Chapter 11.
Steps in Preparing a Work Sheet Step 1 Write in the title of the work sheet and all of the headings: • Accounts • Trial Balance • Income Statement • Balance Sheet
Steps in Preparing a Work Sheet Step 2 Enter all accounts, with their balances, in the first two columns.
Assets, Liabilities, Capital and Drawings in the Balance Sheet columns. Revenue and Expenses in the Income Statement columns. Steps in Preparing a Work Sheet Step 3 Extend each of the amounts from the trial balance.
Steps in Preparing a Work Sheet Step 4:Balance the work sheet … (a) take totals
If they are not equal, the work sheet does not balance. Errors must be found before proceeding to the preparation of financial statements. Make sure the difference for the Income Statement columns equals the difference for the Balance Sheet columns. Steps in Preparing a Work Sheet Step 4:(b) calc. difference
Steps in Preparing a Work Sheet Step 4:(c) Record the balancing figure (difference) in the appropriate Income Statement and Balance Sheet columns. Because revenues (Income Statement credits) are greater than expenses (debits) the difference is Net Income and it is recorded in the debit column. The balancing figure appears on the credit side of the Balance Sheet section, because Net Income represents an increase in capital.
Steps in Preparing a Work Sheet Income Statement Columns Revenue (credits) greater than expenses (debits). Result … Net Income. Balance Sheet Columns Net Income (the balancing figure) is on the credit side as it is an increase to capital
Steps in Preparing a Work Sheet Income Statement Columns If the work sheet showed a Net Loss, the expenses (debits) would be greater than the revenues (credits). The Net Loss (balancing figure) would be in the credit column. Balance Sheet Columns If the work sheet showed a Net Loss, the balancing figure would be on the debit side as it is an decrease to capital.
The Work Sheet and theFinancial Statements Review the format
Steps in Preparing a Work Sheet Review the format
Accounts Payable Miscellaneous Expense Revenue Advertising Expense Wages Expense Mortgage Payable Utilities Expense Equipment G. Rojek, Capital Delivery Expense GST Recoverable Bank Loan Accounts Receivable Automobile Bank G. Rojek, Drawings Sales Bank Charges Expense Rent Expense Supplies Trucks GST Payable Class Workp. 260, Exercise 1 • For each account listed below, indicate whether it would be extended to the Income Statement or Balance Sheet, debit or credit columns.
Class Workp. 261, Exercise 2 Prepare a work sheet for N. Foreman and Company for the month ended April 30, 2007.
Class Workp. 262, Exercise 4 Locate errors and make necessary corrections.
Homeworkp. 261, Exercise 3 Prepare a work sheet for Collision Bodywork and Repairs for the year ended December 31, 2007.
Comparing Income Statements When comparing income statements for two consecutive years, accountants often make the following two calculations for each statement item: • The dollar amount of the increase or decrease from the first year to the second; and • The percentage amount of the increase or decrease from the first year to the second.
Comparing Income Statements 9,110 . 50,250 X 100
Trend Analysis • A trend analysis shows financial data over a number of consecutive periods. • It is not easy to interpret a trend just by looking at the numbers. • Calculating a percentage change compared to a base year adds meaning to the numbers. • Graphing the data can also provide a better perspective of the trend over time.
60,000 55,000 75,000 55,000 45,000 55,000 105,000 55,000 112,000 55,000 X 100 X 100 X 100 X 100 X 100 Trend Analysis
Common-Size Income Statements • At times, it may be necessary to compare the income statements of two different companies. • To make two companies “look the same”, convert each dollar amount to a percentage using the sales figure as the base. • Showing these percentages puts the income statement in common-size form.
Class / Homework • p. 266/267, Exercise 1 • p. 267, Exercise 3 (use format on p. 264) • p. 267, Exercise 4 (may use computers) • p. 268, Exercise 5 (may use computers) • p. 268, Exercise 6 (may use computers)
Account Form Report Form Heading Heading Assets Assets Liabilities And Owner’s Equity Liabilities And Owner’s Equity Total Total Total Total Balance SheetAccount Form vs. Report Form
Classified Balance Sheet • Provides useful totals for comparison. • For example, current assets and current liabilities. • These match up well because the time frame for both is one year. • The difference between current assets and current liabilities is known as working capital. • Working capital is an indication of a company’s ability to meet current obligations.
Classified Balance Sheet • Another example, fixed assets and long-term liabilities. • These match up well because the time frame for both is greater than one year. • A comparison of these totals provides insight into the financing of fixed assets. • This also provides an indication of what portion / percentage of fixed assets continue to be financed through long-term debt.
Class / Homework • p. 276, Exercise 1 • p. 277, Exercise 2 • p. 277, Exercise 3 • p. 278, Exercise 5 • p. 279, Exercise 6
Accountability • Accounting data is used in many ways, the most important of which is to provide information for the financial statements. • Accountability is the company officers’ obligation to show how well they have been managing the company. • The financial statements provide evidence of accountability.
Users of Financial Statements The five groups who use financial statements most commonly are: • Managers – managers probably us the financial statements more than any other group. They use past performance in order to improve results and efficiency, and to eliminate weaknesses. • Owners – many owners are not directly involved in managing their companies. Financial statements help them evaluate the performance of the management team.
Users of Financial Statements • Creditors – particularly bankers, ask for financial statements to assess the company’s progress and its ability to meet its loan obligations. • Shareholders – the law requires that corporations provide their shareholders with financial statements. The shareholders are the real owners of an incorporated company and can use this information to assess progress. • Investors and brokers – shares of public corporations are traded through the stock exchange. Employees of stock brokerage firms and potential investors stay informed by reading corporate financial reports.
Quality of Financial Statements • Users of financial statements expect accurate, complete, up-to-date, and reliable information. • Generally Accepted Accounting Principles (GAAPs) play an important role in the accountability process … they provide the users of financial statements with confidence in the numbers.
Quality of Financial Statements • An audit is a critical review by a public accountant of the internal controls and accounting records of a company. • The audit makes it possible to evaluate the fairness of the company’s financial statements.
Quality of Financial Statements • In addition to the GAAPs previously discussed, the following help produce credible financial statements: The consistency principle requires that a business must use the same accounting methods and procedures from period to period. • If there is a change in method from one period to another, the financial statements must clearly indicate the change. • Consistency is assumed unless otherwise stated. • Consistency prevents manipulation of information through the changing of methods of accounting.
Quality of Financial Statements The materiality principle requires accountants to include in a firm’s financial statements any information that could be considered material (or important) to the users of that financial information. • For information not to be included, it must be such that neither the net income nor the financial position of the firm are impacted in any significant way. • Excluding particular information must not lead statement users to make decisions different from what they would make were they to have that information.
Quality of Financial Statements The full disclosure principle states that all information needed for a full understanding of the company’s financial affairs must be included in the financial statements. • Some items that are necessary for an understanding of the company’s financial affairs may not affect the ledger accounts directly. • Such items would be included in the form of accompanying notes to the financial statements. • e.g. Pending litigations, tax disputes, company takeovers, etc.
Class / Homework • p. 293, Exercise 3 • p. 293/294, Exercise 4 • p. 295, Exercise 5 • p. 296, Case 1 • p. 297, Case 2