Download
1 / 62
620 likes | 760 Views
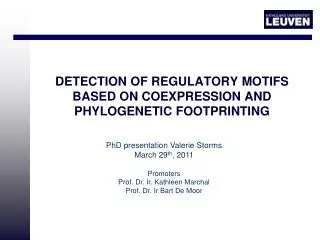
DETECTION OF REGULATORY MOTIFS BASED ON COEXPRESSION AND PHYLOGENETIC FOOTPRINTING. PhD presentation Valerie Storms March 29 th , 2011 Promoters Prof. Dr. Ir. Kathleen Marchal Prof. Dr. Ir Bart De Moor. Overview. Introduction on transcriptional regulation

E N D
DETECTION OF REGULATORY MOTIFSBASED ON COEXPRESSION AND PHYLOGENETIC FOOTPRINTING PhD presentation Valerie Storms March 29th, 2011 Promoters Prof. Dr. Ir. Kathleen Marchal Prof. Dr. Ir Bart De Moor
Overview • Introduction on transcriptional regulation • The effect of orthology and coregulation on detecting regulatory motifs • PhyloMotifWeb: workflow for motif discovery in eukaryotes • De novo motif discovery in vitamin D3 regulated genes
Genetic information All living organisms consists of one or more cells • E.g. humans: • Built of multiple cells like nerve cells, muscle cells, skin cells • Every cell: contains identical genetic information Genetic information • Stored as DNA (deoxyribose nucleic acid) • Double helix with sugar-phosphate backbone • 4 building blocks = “base” • A: adenine • C: cytosine • G: guanine • T: thymine / U: uracil • Complementary base pairing -> hydrogen bounds • Presentation: ACCTGCTAG….ATTGACGGAC - C - G - C - T - A - G - C - A - T - C - C - A - T - A G C G A T C G T A G G T A T Sugar-Phosphate Backbone Base pair A-T Base pair G-C
Gene DNA TRANSCRIPTION TRANSLATION mRNA protein Genetic dogma DNA contains genes = specific sequences of bases that encode instructions on how to make proteins = work units of a cell ….AAATTTGGTTGTTGTCTCCCAGCTGTTTATTTCTGTAACAGATCTTGGAGGCTGCGGTCTGGATCCCTCGCCAAGAACCAGATCCAGGAGAAAACGTGCTCAACGTGCAGCTCTGCTCCTACTGATTATAGCCCCACAGATGACATCGCTCCATAGTCACACCAAGTCTCCTGTGGGAGTCTTGCTCCTCGTTCTCAGTGTCTGTTACAGCTCGGTATTTTAGTGTCAGGACGTCGGCTCCCAGCCCGCATCTCCGCTCAGCAATGCCATTATCTTCTCAGCCAAGTCCTAGAAATGGGTTGGCTTCCCATTTGCAAAAACATCGCTCCATAGTCACACCAAGTCTCCTGTGGGAGTCTTGCTCCTCGTTCTCAGTGTCTGTTACAGCTCGGTATTTTAGTGTCAGGACGTCGGCTCCCAGCCCGCATCTCCGCTCAGCAATGCCATTATCTTCTCAGCCAAGTCCTAGAAATGGGTTGGCTTCCCATTTGCAAAAACATCGCTCCATAGTCACACCAAGTCTCCTGTGGG…. TRANSCRIPTIONAL REGULATION DIFFERENT LEVELS OF REGULATION GENEXPRESSIE
TF Main players in Transcriptional regulation • Recruitment of the RNA POLYMERASE COMPLEX to the promoter region of the target gene Co-activator RNA polymerase complex TSS TARGET GENE DNA Promoter region This process can be activated or repressed by: • Transcription Factors (TFs) – activators and repressors • Bind DNA directly by recognizing specific regions • Co-activators and co-repressors • Recruited by protein-protein interactions
Linear DNA molecule Histones TF Heterochromatin Euchromatin Main players in Transcriptional regulation • Chromatin structure • Eukaryotic cells • Nucleus • Linear DNA molecules organized into chromosomes • Chromatin= complex of DNA and proteins • Influences • Transcriptional Regulation
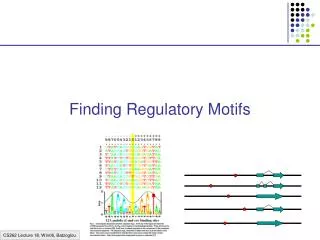
ATTGCCAT Main players in Transcriptional regulation • TFs bind specific non-coding sequences in the DNA to control the expression of their target genes TF binding sites • All genes regulated by the same TF contain a similar TF binding site in their promoter region • REGULATORY MOTIF models the TF-DNA binding specificity and captures the variability of TF binding sites Co-activator RNA polymerase complex TF TF TSS Chromatin remodeling complex TARGET GENE REGULATORY MOTIF DNA - Modify chromatin structure: - DNA methylation - Histone modifications like methylation, acetylation TF-DNA INTERACTION
A 0.01 0.01 0.01 0.97 0.01 0.01 C 0.01 0.01 0.01 0.01 0.97 0.29 G 0.97 0.01 0.97 0.01 0.01 0.69 T 0.01 0.97 0.01 0.01 0.01 0.01 p1 p2 p3 …. pn Regulatory motif TF REGULATORY MOTIF G T G A C G G T G A C C G A G A C G G T G T C G G T C A G G Alignment of TF binding sites Construction of frequency matrix Motif logo
Computational motif discovery ? TF Motif scanning De novo motif discovery 1. Motif scanning: known motif model 2. De novo motif discovery: search for novel, uncharacterized motifs Algorithms classified based on the information sources they use: - Coregulation information - Orthology information - Co-localization of different TF binding sites - Chromatin structure • Different algorithms to predict TF binding sites • Two different computational approaches!
Overview • Introduction on transcriptional regulation • The effect of orthology and coregulation on detecting regulatory motifs • PhyloMotifWeb: workflow for motif discovery in eukaryotes • De novo motif discovery in vitamin D3 regulated genes
1. Coregulation space 2. Orthologous space Different information spaces Next generation of motif discovery tools integrates orthology with coregulation information 3. Combined coregulation-orthology space
Study Research goal: • Extent of information in coregulation or orthologous space • Conditions under which complementing both spaces improves motif detection Method: • Synthetic and real benchmark datasets • Select motif detection tools flexible enough to perform in each of the three spaces -Phylogibbs(Siddharthan et al., 2005) -Phylogenetic sampler(Newberg et al., 2007) - MEME (Bailey and Elkan, 1994)
Theoretical comparison Overview Noevolutionary model Unaligned sequences Phylogenetic relatedness between the orthologous sequences Tree-based evolutionary model Alignment of the orthologous sequences needed
Theoretical comparison Assignment and scoring of motif sites Single independent motif sites Window principle -> more flexible in case of a bad prealignment Block principle -> very sensitive to bad prealignments -> leave out phylogenetic distant orthologs Prealigned Multiple orthologous motif sites Tree-based evolutionary model (F81)
TC…T TT…T … TC…C 4 5 REF SPECIES Seq 1 Seq 2 … Seq 10 SPECIES 1 3 SPECIES 2 SPECIES 3 SPECIES 4 2 Performance assessment Construction of Synthetic datasets Background sequences Motif WMs with a different IC 1 Seq 1 Seq 2 … Seq 10 Ancestor species Use a phylogenetic tree and an evolutionary model to create the orthologs for different species Coregulation Orthologous Combined
Urs1H LexA Rap1 TyrR Performance assessment Construction of Real datasets Biological datasets: Prokaryotic data -> Gamma-proteobacteria Eukaryotic data -> yeast species
Performance assessment Results (1) … COREGULATION SPACE Depends on the degeneracy of the embedded motif Does adding orthologs improve the performance for the LOW IC motif?
… … Performance assessment Results (2) COMBINED SPACE 1. Evolutionary distance between the added orthologs
Performance assessment Results (3) 2. Phylogenetic tree => Tree based on neutral evolution rate 3. The number of added orthologs and the topology of the tree => low impact 4. Noise => Orthologous direction: performance drop depends on the species distance and the algorithm characteristics
Performance assessment Results (4) ORTHOLOGOUS SPACE Room for improvement! • Number of added orthologs • larger effect than in • combined space • PS • Almost no output when orthologs are prealigned • (No centroid solution)
Conclusions Quality of predicted motifs depends on correctness of prealignments Challenge: accounting for phylogenetic relatedness, independent of a prealignment Ensemble centroid strategy Useful with low signal/noise Computationally limiting Phylogenetic tools may perform better than the more basic MEME tool BUT More parameters to tune Performance strongly depends on the prealignment quality, the phylogenetic tree, the relationship between the orthologs etc…
Overview • Introduction on transcriptional regulation • The effect of orthology and coregulation on detecting regulatory motifs • PhyloMotifWeb: workflow for motif discovery in eukaryotes • De novo motif discovery in vitamin D3 regulated genes
PhyloMotifWeb Motif finders with different algorithmic background performance diversity Progress of experimental technologies Ensemble strategy combine results of multiple algorithms Growing number of sequenced genomes Orthology information Epigenetic information Chromatin structure information Ensemble phylogenetic motif finders Create orthologs alignments phylogenetic tree Automatic parameter sweep Easy reduction of search space
PhyloMotifWeb – Ensemble strategy • Three motif finders: Phylogibbs, Phylogenetic sampler and MEME • Run each motif finder across multiple parametersettings (e.g. different motif numbers, motif widths etc.) Large collection of output matrices • FuzzyClustering algorithm • summarizes all these output matrices into a set of non-redundant ensemble motifs • Works on the TF binding site level <-> matrix level
PhyloMotifWeb Motif finders with different algorithmic background performance diversity Progress of experimental technologies Ensemble strategy combine results of multiple algorithms Growing number of sequenced genomes Orthology information Epigenetic information Chromatin structure information Important for motif discovery in eukaryotes! Ensemble phylogenetic motif finders Create orthologs alignments phylogenetic tree Automatic parameter sweep Easy reduction of search space
PhyloMotifWeb - Eukaryotes Restrict search space to regions with higher regulatory potential based on epigenetic information like chromatin structure BUT: Tissue and condition dependent! Annotation of regulatory regions > Regulatory build pipeline of Ensembl • Multi-cell type: • DNase hypersensitivity -> open chromatin • CTCF binding sites -> enhancer/insulator marker • Binding sites of other TFs • Cell-type specific: • Histone modifications
Results page - Motif logo - Individual binding sites of the ensemble solution - p-value for theoverrepresentation of the ensemble motif in the sequence set versus random sequence sets - Comparison with database motifs
Overview • Introduction on transcriptional regulation • The effect of orthology and coregulation on detecting regulatory motifs • PhyloMotifWeb: workflow for motif discovery in eukaryotes • De novo motif discovery in vitamin D3 regulated genes
Vitamin D3 - metabolism • Source: Diet and produced in skin when exposed to sunlight • Role in regulating many physiological and cellular processes: • - Bone health • - Prevention of autoimmune diseases • - Anti-proliferative effect on different cell types like cancer cells
VitD3 VitD3 VitD3 VitD3 VDR VDR VDR VDR RXR RXR RXR VDRE Co-activator complex Chromatin remodeling complex DRIP Transcription machinery Target gene Vitamin D3 - mode of action 1. Vitamin D3 enters the cell and binds to the vitamin D receptor (VDR), which dimerizes with RXR 2. Ligand-activated VDR/RXR binds the DNA at Vitamin D Regulatory elements (VDRE) 3. Recruitment of co-activators and chromatin remodelers: open chromatin structure 4. Transcription of the VDR target gene
VitD3 Mouse bone cells VitD3 RXR VDR Target gene ANTI- PROLIFERATIVE PHENOTYPE VDRE VERSUS Human breast cancer cells Ctr Vitamin D3 - dataset • GOAL: get insight in molecular mechanism underlying anti-proliferative effect of vitD3 • - Human and mouse cell lines treated with vitD3 versus no vitD3 (Control) • - Measured the expression of all genes in the human and mouse cells using microarrays for both conditions over different time points • Select differentially expressed genes (vitD3 versus Control) -> phenotype • Group per species all genes with similar behavior in coexpression clusters • focus on genes with a conserved co-expression behavior across human and mouse interesting for common anti-proliferative phenotype
Vitamin D3 - Dataset Conserved coexpression cluster: - 10 genes - Upregulated after vitD3 Assume: conserved transcriptional regulation Conserved regulatory motifs responsible for expression behavior De novo strategy Screening: Co-localization of TF binding sites
Vitamin D3 - de novo motifs METHOD: PhyloMotifWeb RESULTS: • Very common motifs • Low specificity for coexpressed cluster • Match with TFs involved in cell cycle regulation • Well conserved TF binding sites, present in many genes! • e.g. SP1, ZF5, NRF1 • TF involved in B-cell differentation • EBF
C1 C2 C1 C2 Vitamin D3 - de novo motifs • Motifs specific for the conserved coexpression cluster -> higher overrepresentation in the cluster compared to the genome -> match with following TFs:
TF2 TF1 TF2 TF1 TF2 TF1 Vitamin D3 – Cis-regulatory modules Higher eukaryotes: -> TFs act in cooperation to modulate gene expression -> Find co-localized binding sites for de novo predicted motifs => CRMs
Vitamin D3 – Cis-regulatory modules METHOD: CPModule INPUT: • De novo predicted motif models • Constraint: module size ranging between 150bp and 400bp RESULTS: • 3 CRMs highly specific for the coexpressed genes (p-value < 0.001): • Each CRM contains the EBF motif -> degenerated -> many hits -> using a motif-specific score threshold • Most interesting is the ZEB1-VDR module
Vitamin D3 - perspectives • Motifs predicted for the conserved coexpression cluster -> investigate their presence for larger species-specific clusters or maybe for the full genome • The availability of cell-type specific epigenetic information can help to retrieve the functional binding sites • Besides a transcriptome analysis -> integrate extra omics data like ChIP-seq and protein profiling to reconstruct the regulatory network of vitD3
Acknowledgements • CMPG-Bioi • Prof. Dr. Kathleen Marchal • Dr. Pieter Monsieurs • Marleen Claeys • Carolina Fierro • Aminael Sanchez • Hong Sun • CMPG • Prof. Dr. Jan Michiels • ESAT-Bioi • Prof. Dr. Bart De Moor • Prof. Dr. Yves Moreau • Wouter Van Delm • LEGENDO • Dr. Lieve Verlinden • Prof. Dr. Mieke Verstuyf • Dr. Guy Eelen • Els Vanoirbeek
Theoretical comparisonPhylogibbs Algorithm (1) Procedure: 1. start with a random configuration C, based on prior information on the number of motif sites/TFs 2. construct the set of all possible configurations C’ that differ in one single move from C (designed moveset) 3. calculate for each C’ the posterior probability score 4. sample a new configuration from this score distribution This procedure is repeated for two phases : 1. Simulated annealing:iterating to configuration C* with the highest posterior probability (=MAP) (temperature parameter β) 2. Tracking: posterior probabilities are assigned to the windows in C* -> One initialization is sufficient -> Very short running time (minutes/hours)
Theoretical comparisonPhylogibbs Algorithm (2) 3. Calculate the posterior probability score: P(C|S) Bayes’ Theorem: P(C|S) ~ P(S|C) = probability that the motif sites of C are drawn from the motif WM and that the background sequence is drawn from the background model EVOLUTIONARY MODEL The motif WM = unknown!! -> integral over all possible WMs : with prior P(WM) modeled by Dirichlet prior distribution Dir(γ) The approximation to solve this integral requires that the tree topologies are reduced to collections of star topologies
Theoretical comparison Phylogenetic sampler Algorithm (1) Procedure: 1. start with a random positioning of blocks (based on prior information on the expected number of motif sites/TFs and max number of motif sites per sequence) 2. update the motif model based on the current blocks (<-> PG) 3. scoring: leave out the blocks for one sequence (<-> PG) and calculate for each possible block the conditional probability score 4. first sample the number of motif sites for the sequence, then sample this number of blocks from the score distribution (3) This iteration procedure is repeated for: 1.Burn-in phase: to converge to local optimum 2. Sampling phase: keep track of all sampled blocks to construct the centroid afterwards -> multiple initializations (seeds) recommended to avoid getting trapped in local maximum -> long running time (hours/days)
Theoretical comparison Phylogenetic sampler Algorithm (2) 2. Update the motif model -> Sample a new motif model from a Dirichlet distribution Dir(β+c) adjusted with phylogenetically weighted counts (based on phylogenetic tree) -> Accept the new motif with a probability proportional to the Metropolis Hastings ratio 3. Calculate the conditional probability score The conditional probability => proportional to the probability that the block is drawn from the motif model (inferred) divided by the probability that the block is drawn from the background model EVOLUTION MODEL The Felsenstein tree-likelihood algorithm is used to handle all tree topologies (<->PG)
Theoretical comparison Solution Phylogibbs Maximum a posteriori (MAP) solution -> set of motif sites (configuration) with the highest posterior probability Phylogenetic sampler Centroid solution -> report all those motif sites that appear in at least half the sampling iterations -> keeps track of all motif sites sampled during sampling iterations to calculate posterior probabilities -> does not take into account joint occurrences of the motif sites Figure from Newberg et al., 2007
Theoretical comparison Evolutionary model Adapted Felsenstein (F81) model -> Describes the substitution process at the nucleotide level -> Assumes that all positions evolve independently and at equal rates (u) -> Probability that a is mutated to b is dependent on the time (t) -> Fixation of b is dependent on its frequency in the motif WM Phylogibbs proximity = q= exp(-ut)= probability that no substitution took place per site Phylogenetic sampler branch length = b = ut AND a different normalization for their branch lengths (k) Convert proximities to branch lengths:::b=-3/4ln(q)