1 / 4

Bland-Altman plot showing difference in measurements of NTBI

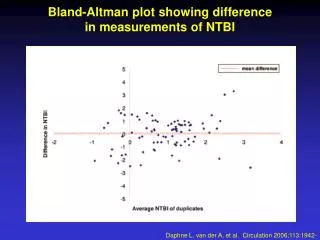
Bland-Altman plot showing difference in measurements of NTBI. Daphne L. van der A, et al. Circulation 2006;113:1942-1949. Baseline Characteristics of the Subcohort ( n 1132) According to NTBI Tertiles. Daphne L. van der A, et al. Circulation 2006;113:1942-1949. HRs (95% CIs) for Risk of CHD.

chaman
Download Presentation

Bland-Altman plot showing difference in measurements of NTBI

An Image/Link below is provided (as is) to download presentation Download Policy: Content on the Website is provided to you AS IS for your information and personal use and may not be sold / licensed / shared on other websites without getting consent from its author. Content is provided to you AS IS for your information and personal use only. Download presentation by click this link. While downloading, if for some reason you are not able to download a presentation, the publisher may have deleted the file from their server. During download, if you can't get a presentation, the file might be deleted by the publisher.

E N D

Presentation Transcript


  1. Bland-Altman plot showing difference in measurements of NTBI Daphne L. van der A, et al. Circulation 2006;113:1942-1949

  2. Baseline Characteristics of the Subcohort (n1132) According to NTBI Tertiles Daphne L. van der A, et al. Circulation 2006;113:1942-1949

  3. HRs (95% CIs) for Risk of CHD Daphne L. van der A, et al. Circulation 2006;113:1942-1949

  4. HRs (95% CIs) for Risk of AMI Daphne L. van der A, et al. Circulation 2006;113:1942-1949

More Related