Testing Hypotheses about a Population Proportion
300 likes | 325 Views
Learn step-by-step guide to hypothesis testing for population proportions using the TI-83 calculator. Includes case study examples and classical approach details.

Testing Hypotheses about a Population Proportion
E N D
Presentation Transcript
Testing Hypotheses about a Population Proportion Lecture 30 Sections 9.3 Wed, Oct 24, 2007
Summary 1. H0: p = 0.50 H1: p > 0.50 2. = 0.05. 3. Test statistic: 4. z = (0.52 – 0.50)/0.0158 = 1.26. 5. p-value = P(Z > 1.26) = 0.1038. 6. Do not reject H0. 7. It is not true that more than 50% of live births are male.
Summary 1. H0: p = 0.50 H1: p > 0.50 2. = 0.05. 3. Test statistic: 4. z = (0.52 – 0.50)/0.0158 = 1.26. 5. p-value = P(Z > 1.26) = 0.1038. 6. Do not reject H0. 7. It is not true that more than 50% of live births are male. Before collecting data
Summary 1. H0: p = 0.50 H1: p > 0.50 2. = 0.05. 3. Test statistic: 4. z = (0.52 – 0.50)/0.0158 = 1.26. 5. p-value = P(Z > 1.26) = 0.1038. 6. Do not reject H0. 7. It is not true that more than 50% of live births are male. After collecting data
Case Study 11 • Male births vs. female births.
Testing Hypotheses on the TI-83 • The TI-83 has special functions designed for hypothesis testing. • Press STAT. • Select the TESTS menu. • Select 1-PropZTest… • Press ENTER. • A window with several items appears.
Testing Hypotheses on the TI-83 • Enter the value of p0. Press ENTER and the down arrow. • Enter the numerator x of p^. Press ENTER and the down arrow. • Enter the sample size n. Press ENTER and the down arrow. • Select the type of alternative hypothesis. Press the down arrow. • Select Calculate. Press ENTER.
Testing Hypotheses on the TI-83 • The display shows • The title “1-PropZTest” • The alternative hypothesis. • The value of the test statistic Z. • The p-value. • The value of p^. • The sample size. • We are interested in the p-value.
Case Study 12 • A recent study has shown that moderate exercise helps reduce the risk of catching a cold. • 53 subjects were assigned to an exercise group that did moderate exercise. • 62 subjects did only stretching exercises. • In the first group, only 5 caught a cold. • In the second group, 20 caught a cold.
Case Study 12 • Use the TI-83 to test the hypothesis that a person who gets moderate exercise has less than a 1 in 3 chance of catching a cold.
The p-Value Approach • p-Value approach. • Compute the p-value of the statistic. • Report the p-value. • If is specified, then report the decision.
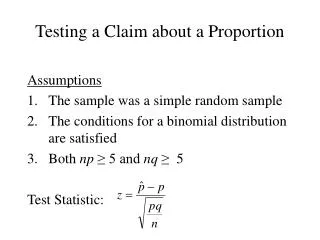
Two Approaches for Hypothesis Testing • Classical approach. • Specify . • Determine the critical value and the rejection region. • See whether the statistic falls in the rejection region. • Report the decision.
Classical Approach H0
Classical Approach H0
Classical Approach H0 z c 0 Critical value
Classical Approach H0 z c 0 Rejection Region Acceptance Region
Classical Approach H0 z c 0 Rejection Region Acceptance Region
Classical Approach H0 Reject z z c 0 Rejection Region Acceptance Region
Classical Approach H0 z c 0 Rejection Region Acceptance Region
Classical Approach H0 Accept z z c 0 Rejection Region Acceptance Region
The Classical Approach • The seven steps • 1. State the null and alternative hypotheses. • 2. State the significance level. • 3.Write the formula for the test statistic. • 4. State the decision rule. • 5. Compute the value of the test statistic. • 6. State the decision. • 7. State the conclusion. • (Do not compute the p-value.)
The Classical Approach • The seven steps • 1. State the null and alternative hypotheses. • 2. State the significance level. • 3.Write the formula for the test statistic. • 4. State the decision rule. • 5. Compute the value of the test statistic. • 6. State the decision. • 7. State the conclusion. • (Do not compute the p-value.) Before collecting data
The Classical Approach • The seven steps • 1. State the null and alternative hypotheses. • 2. State the significance level. • 3.Write the formula for the test statistic. • 4. State the decision rule. • 5. Compute the value of the test statistic. • 6. State the decision. • 7. State the conclusion. • (Do not compute the p-value.) After collecting data
Example of the Classical Approach • Test the hypothesis that there are more male births than female births. • Let p = the proportion of live births that are male. • Step 1: State the hypotheses. • H0: p = 0.50 • H1: p > 0.50
Example of the Classical Approach • Step 2: State the significance level. • Let = 0.05. • Step 3: Define the test statistic.
Example of the Classical Approach • Step 4: State the decision rule. • Find the critical value. • On the standard scale, the value z0 = 1.645 cuts off an upper tail of area 0.05. • This is a normal percentile problem. • Use invNorm(0.95) on the TI-83 or use the table. • Therefore, we will reject H0 if z > 1.645. The decision rule
Example of the Classical Approach • Step 5: Compute the value of the test statistic.
Example of the Classical Approach • Step 6: State the decision. • Because z < 1.645, our decision is to accept H0. • Step 7: State the conclusion. • The proportion of male births is not greater than the proportion of female births.
Summary • H0: p = 0.50 H1: p > 0.50 • = 0.05. • Test statistic: • Reject H0 if z > 1.645. • Accept H0. • The proportion of male births is the same as the proportion of female births.
Case Study 12 • Use the TI-83 and the classical approach to test the hypothesis that a person who gets moderate exercise has less than a 1 in 3 chance of catching a cold.