Download
1 / 44
620 likes | 962 Views
Chapter 1: The Economic Way of Thinking. Sec. 1: Scarcity: The Basic Economic Problem. What is Scarcity?. Wants – Needs – . People always want more, no matter what they have wants are unlimited, but resources to fill are limited Scarcity –

E N D
What is Scarcity? • Wants – • Needs – • People always want more, no matter what they have • wants are unlimited, but resources to fill are limited • Scarcity – • not a temporary shortage, it is a problem facing individuals, businesses, govt., society • Science to study it is called economics
Economics – the study of how people choose to use scarce resources to satisfy their wants • Econ involves: • Examining – • Organizing, analyzing, and interpreting data about those economic behaviors • Developing theories and economic laws that explain how the economy works and to predict what might happen in the future.
Principle 1: • Choice is central to the use of scarce resources. • Choices about needs – what kind of food • Choices about wants – these are unlimited & ever changing • Principle 2: • Scarcity affects which goods are made and services are provided • Goods – physical objects that can be purchased • Services – work that one person performs for another for payment • Consumer – • Producer –
Question 1: • Society must decide the mix of goods and services it will produce • what is produced depends on the natural resources possessed • but resources do not completely control what a country produces • some countries decide by allowing consumers and producers to decide • in other countries, the govt. decides what goods and services will be produced • This question also involves how much to produce • the country must review its wants at any time to decide this
Question 2: • This involves using scarce resources in the most efficient ways to satisfy wants • this is also influenced by the natural resources that a society possesses • ex. - growing crops – different approaches • large unskilled labor force – labor intensive methods – few machines • highly skilled labor force – capital intensive – lots of machines
Question 3: • This involves how goods will be distributed among people in society • Questions –Need to determine how much people should get how much they pay or equal share • Distribution networks –
-the economic resources needed to produce goods and services The Factors of Production
Factor 1: • Includes all natural resources found on or under the ground that are used to produce goods and services
Factor 2: • is all the human time, effort, and talent that goes in to the making of products
Factor 3: • is all the resources made and used by people to produce and distribute goods and services • ex. – • human capital – • ex. – college, job training
Factor 4: • Is the combination of vision, skills, ingenuity, and willingness to take risks that is needed to create and run new businesses • most entrepreneurs are innovators • try to anticipate and meet needs of consumers in new ways • new product, method of production, way of marketing or distributing • Are also risk takers – risk time, energy, creativity, money in hope for profit
Making Choices -What shapes the economic choices? -incentive – -utility – -“economize” – consider both incentive and utility – -make decisions according to what you believe is the best combination of costs and benefits
Factor 1: Factor 2: Every choice involves costs Money, time, or something else of value • Choices are shaped by incentive, expected utility, and the desire to economize • Costs vs. benefits – looking for best mix of costs and benefits • Making decisions – guided by self-interest – looking for ways to maximize utility
Trade-Offs and Opportunity Costs Trade-offs –
Example 1: Example 2: Opportunity cost – Alternative over another *choice – work for year vs. work for 6 months and travel for months Selects work for 6 months and travel for 6 months – less income, but visits friends • *choice – semester long course at university vs. 6 week course at high school • selects 6 week course, less credits, but gets summer vacation
Analyzing Choices -cost-benefits analysis – -useful tool for individuals, businesses and govt. when to evaluate relative worth of economic choices
Example: Max’s Decision-Making Grid • application of cost-benefit analysis is decision-making grid • shows what you get and what you give up when you make choices • costs and benefits change over time, as do goals and circumstances • changes influence decisions people make
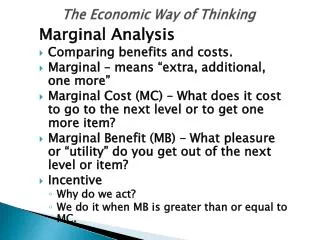
Example: Marginal Costs and Benefits • marginal costs – • marginal benefit – • analysis is central to study of economics • helps explain the decisions consumers, producers, and govt. make as they try to meet their unlimited wants with limited resources
Graphing the Possibilities • Economic models – • Production Possibilities Curve(PPC) – a graph used to illustrate the impact of scarcity on an economy by showing the maximum number of goods or services that can be produced using limited resources
PPC assumptions • Resources are fixed – no way to increase the availability of land, labor, capital and entrepreneurship • All resources are fully employed – there is no waste of any of the factors of production • Only two things can be produced – assumption simplifies the situation and suits the graphic format – one variable on each axis • Technology is fixed – no technological breakthroughs to improve methods of production • -Curve represents border or frontier between what is and what is not possible to produce also called a Production Possibilities Frontier useful for bus. & govt., but can be used by individual
Production Possibilities Curve • Figure 1.3 – 5 production possibilities for loaves of bread and bran muffins • Figure 1.4 – graph plotted from data in table – line is the PPC • points represent maximum of one product relative to the other • also shows opportunity cost of one product compared to the other
What We Learn From PPCs • No economy operates according to simplified assumptions of PPC • but it spotlights concepts that work in the real world of scarce resources • Efficiency – • Underutilization –
Example: Efficiency and Underutilization • Figure 1.5 – guns vs. butter – military vs. consumer production • each point the on curve shows different combination of each, and each represents efficiency • each point inside the curve is underutilization, and points outside the curve are impossible because resources are fixed
Example: Increasing Opportunity Costs • Figure 1.5 – switching from guns to butter or butter to guns • each additional unit costs more to make than the last, explains bow shape of curve • reason – making one is different from making the other – new machines, factories, and retrain Workers
Changing Production Possibilities • The PPC represents present PP if resources are fixed, but that usually changes over time • additional resources means new PP and the PPC moves outward • Example: A Shift in the PPC in the 1700s the US occupied only a small area along the Atlantic • 100 yrs. Later, it expanded to the Pacific – meaning the addition of resources, in addition to the added immigrants means additional labor • this is shown on the PPC as a shift of the curve outward – this is called economic growth
Working with Data • Economics is something that everyone knows and works with everyday • Economists study this to figure out why some nations are rich or poor and why consumers want one product while others want another product • Statistics –
Using Economic Models • Models are based on assumptions and are simplified because they are based on a limited number of variables • models expressed in words, graphs or equations • explain why things are as they are, help predict future economic activity
Using Charts and Tables • Look for trends, connections and other interesting relationships • Showing numbers in relation to other numbers can reveal patterns in the data
Using Graphs • Graphs are used to ID trends in statistics • Line graph – useful for showing changes over time • Line graphs use 2 sets of numbers or variables – one on horizontal and one on vertical axis • The numbers of what is being used are plotted on the graph and connected to form a line • upward slope – upward trend • downward slope – downward trend • straight line – same slope • curved line – varied slope
Bar Graph – useful for comparisons • vividly shows changes in data • Pie Graph – • slices drawn in proportion to the number they represent
Microeconomics & Macroeconomics -Microeconomics – -Macroeconomics – is the study of the behavior of the economy as a whole and involves topics such as inflation, unemployment, aggregate demand, and aggregate supply
Microeconomics • Micro – • examines specific, individuals elements in the economy • prices, costs, profits, competition, behavior of consumers and producers • areas of specialized concentration • business organization, labor markets, agricultural economics, econ of environmental issues
Macroeconomics • Macro – • examines the big picture – economy as a whole • the effect of widespread unemployment on the whole nation • a general rise on prices • studies the consumer sector (household sector), business sector, and public or govt. sector • Sector – • bring a national or global perspective to work • study monetary system, up and down of business cycles, impact of national tax policies on economy, international trade and effect on rich and poor nations
Positive Economics and Normative Economics -Positive economics – way of describing and explaining economics as it is and not how it should be, involves verifiable facts - Normative economics –
Positive economics Normative economics Based on value judgments goes beyond facts to ask if actions are good, values differ, so then recommendations will • Uses scientific method – • Statements can be tested against real world data and either proved or disproved
Adam Smith: Founder of Modern Economics • Born in Kirkcaldy, Scotland in 1723 • Studied and taught literature, logic, and moral philosophy • 1764 – traveled to France – the Enlightenment – result – looked at world in new way
-1776 – • challenged idea of mercantilism – govt. controlled trade with its colonies • said free trade would be better • said people behave in ways that satisfy their economic self-interests • an invisible hand guides the marketplace • buyers and sellers benefit from each transition • becomes foundation of modern economics