Download
1 / 19
190 likes | 354 Views
NC Youth Risk Behavior Survey 2011. % of HS Students Who Have Witnessed Another Student Bullied. 23% 43% 63% 83%. % of HS Students Who Have Been Electronically Bullied During the Past 12 Months. 16% 28% 41% 52%.

E N D
% of HS Students Who Have Witnessed Another Student Bullied • 23% • 43% • 63% • 83%
% of HS Students Who Have Been Electronically Bullied During the Past 12 Months • 16% • 28% • 41% • 52%
% of HS Students Who Have Ever Been the Victim of Teasing or Name Calling During the Last 12 Months Because Someone Thought They Were Gay, Lesbian or Bisexual • 6% • 10% • 13% • 21%
% of HS Students in Whose School is Gang Activity • 23% • 40% • 59% • 71%
% of HS Students Who Get 8 or More Hours of Sleep on an Average School Night • 27% • 32% • 41% • 67%
% of HS Students Who Are Overweight (above 85th percentile but below 95th percentile for Body Mass Index (BMI) by age and sex) • 7% • 16% • 28% • 40%
% of HS Students Who Are Obese (at or above 95th percentile for Body Mass Index (BMI) by age and sex) • 7% • 13% • 28% • 40%
% of HS Students Who Have Had Sexual Intercourse • 22% • 31% • 49% • 64%
% of HS Students Who Were Physically Active for 60 or More Minutes 5 of Last 7 Days • 48% • 54% • 63% • 84%
% of HS Students Who Had Seriously Considered Suicide in Last 12 Months • 4% • 14% • 21% • 38%
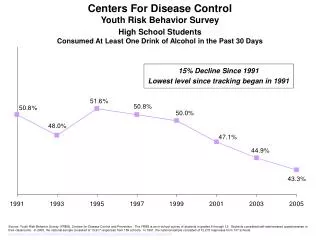
% of HS Students Who Drank Alcohol in the Last 30 Days • 9% • 14% • 29% • 34%
% of HS Students Who Have Ever Used Marijuana • 15% • 27% • 43% • 61%
% of HS Students Who Drove a Car or Other Vehicle When They Had Been Drinking Alcohol on One or More of the Past 30 Days • 6% • 14% • 21% • 33%
% of HS Students Who Have Texted or Emailed While Driving a Car or Other Vehicle on One or More of the Past 30 Days • 15% • 26% • 35% • 48%
% of Middle School Students Who Watch 3 or More Hours Per Day of TV on an Average School Day • 15% • 23% • 39% • 51%
% of MS Students Who Road in a Car Driven by Someone Who Had Been Drinking • 9% • 14% • 23% • 34%
% of MS Students Who Have Ever Been Bullied on School Property • 12% • 23% • 42% • 51%
% of MS Students Who Have Ever Had a Alcohol (other than a few sips) • 8% • 17% • 29% • 43%