Download
1 / 41
440 likes | 713 Views
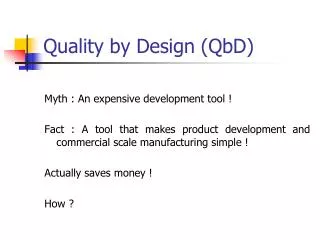
Pharmaceutical 6-Sigma Quality by Design. Ajaz S. Hussain, Ph.D. Office of Pharmaceutical Science CDER FDA. The 28 th Annual Midwest Biopharmaceutical Statistical Workshop May 23-25, 2005 * Ball State University, Muncie, IN. Outline. Background & Terminology

E N D
Pharmaceutical 6-Sigma Quality by Design Ajaz S. Hussain, Ph.D. Office of Pharmaceutical Science CDER FDA The 28th Annual Midwest Biopharmaceutical Statistical Workshop May 23-25, 2005 * Ball State University, Muncie, IN
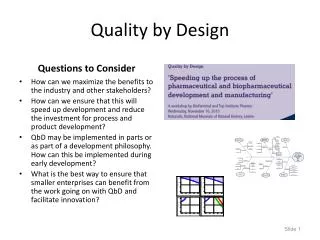
Outline • Background & Terminology • Pharmaceutical product and process quality – what is the current “sigma”? • Challenges in moving towards “6-sigma” levels? • What are the steps necessary for the pharmaceutical continuous improvement journey in the 21st Century?
Remembering a few Guru’s of Quality “Failure of management to plan for the future and to foresee problems has brought about waste of manpower, of materials, and of machine-time, all of which raise the manufacturer's cost and price that the purchaser must pay.” - Deming
Manufacturing Process Performance • A set of causes and conditions that repeatedly come together to transform inputs into outcomes • Inputs: Information, Materials, .... • Outcomes: Products, Information,… • Quality characteristics of the outcomes are indicators of performance • Will vary over time and location, and analysis of this variation is generally a basis for action Nolan and Provost. Quality Progress, May 1990
Decisions: Interpretation of variation • Decisions are often based on interpretation of patterns of variations • Indicative of a trend or of random variation (that is similar to what has been observed in the past) • Misinterpretation leads to losses • Blaming people for problems beyond their control • Spending unnecessary resources investigating and/or taking actions to address perceived trends nothing has changed • “Crying wolf” too often may desensitize a quality system and reduce its alert level to address a “real wolf” when one will appear
Specifications & Tolerances Fitness for Use Control Chart 1800 AD 1924 5000 BC Methods to Manage Variation: A Historical Perspective Interchangeability of parts Provost and Norman. Quality Progress December 1990
Shewhart’s Common & Special Causes of Variation • Common causes of variation are inherently part of the process (or system) all the time and affect every one working in the system • Special causes are those that arise because of specific circumstances, i.e., not present all of the time and do not affect every one working in the system • A “Control Chart” is a tool to distinguish between the two types Nolan and Provost. Quality Progress, May 1990
Stable and Unstable Process • A process (or a system) that has only common cause affecting the outcomes is called a stable process (in a state of statistical control) • When such a process is demonstrated to meet its intended function, variation in such a system are acceptable • When both common and special cause affect the outcomes – Unstable process (magnitude of variation from one time period to the next is unpredictable) Nolan and Provost. Quality Progress, May 1990
Unstable Stable & Capable Stable and Unstable Process
Benefits of a Stable Process (Deming) • The process has an identity; its performance is predictable • Rational basis for planning leading to the concept of “just in time manufacturing” • Cost of quality is predictable - Productivity is at a maximum and costs at a minimum for a give system • The effect of changes in the process can be measured with greater speed and reliability • In an unstable system it is difficult to separate changes to the process from special causes. Therefore, it is difficult to know when a change results in improvement Nolan and Provost. Quality Progress, May 1990
6s “Six Sigma” A 3s process - because 3 standard deviations fit between target and acceptance goalposts “Design for Six Sigma” Before CustomerSpecification Target 3s 1s 2s 3s After “Defects ~ 66807 ppm” 6s CustomerSpecification Target Continuous improvement: By reducing variability we improve the process 1s 3s “Defects ~ 3.4 ppm”
Process Capability: Cp and Cpk • Cp does not take into account any non- centering of the process relative to the specification limits • Cp = S/P • Cpk = (1-K)Cp • K = [(D-X)/(X/2)] or [(X-D)/(S/2)] • S = acceptance criteria width; P = process width (+/- 3σ limits); D = design center; X = process average
Process Capability & “Sigma” * Statistical σ; not the “Six Sigma” calculation (Bhote and Bohte, 2000)
What is Continuous Improvement • Two concepts that describe Continuous Improvement are • KAIZEN (Ky’ zen) a Japanese word is often translated in the west as ongoing, continuous improvement • Evolutionary Operation (EVOP) • It is distinguished from “innovation” and “corrective actions”
120 100 80 Probability of Meeting Criteria, 60 40 20 0 0 1 2 3 4 5 6 7 8 9 10 11 12 Total RSD, % Elements necessary for Continuous Improvement • Human resources are the most important company asset • Processes must evolve by gradual improvement rather than radical changes • Improvement must be based on statistical/quantitative evaluation of process performance Slides from Norman Winskill and Steve Hammond FDA Science Board Nov. 2001 Need to recognize the underlying operating characteristics of our specifications
Quality System Requirements QS-9000Third Edition element 4.2.5—Continuous Improvement (1998). • For those product characteristics and process parameters that can be evaluated using variable data, continuous improvement means optimizing the characteristics and parameters at a target value and reducing variation around the value. • For those product characteristics and process parameters that can only be evaluated using attribute data, continuous improvement is not possible until characteristics are conforming. • If attribute data results do not equal zero defects, it is by definition nonconforming product. Improvements made in these situations are definition corrective actions, not continuous improvement. • Continuous improvement [shall be undertaken] in processes that have demonstrated stability, acceptable capability and performance.
What is the current pharmaceutical “sigma” value? • How should we define pharmaceutical “sigma”? • Product quality • % of units in a batch outside the regulatory or compendial acceptance criteria • % of batches recalled • Process quality • % of batches rejected • % of batches “right 2nd or 3rd time” • What is the minimum regulatory “sigma” value? • One interpretation: “A process is no longer considered validated when the recall rate exceeds 10%”?
What is the current pharmaceutical “sigma” value? For many products and processes: Process Quality at about “2σ”? Product Quality > “5σ”? If so, are we not trapped in a “corrective action crisis” and also wasting lot of resources?
Pharmaceutical “Customer” Specifications • Often combine attribute (no unit outside..) and continuous variable (RSD) in quality decision process • For example: Dose Content Uniformity • Upper Specification Limit = 125% • Lower Specification Limit = 75% • Standard Deviation not to exceed 7.8% • Test sample size 30 • “No unit in 30 is outside 75-125%”
Process Capability and Variability • Without the “attribute” criterion • Assuming a stable process; normal distribution • Mean = 100%, %RSD = 7.8%, n=30 • Cp=Cpk = 1.07 and • ~ “3σ” process • Standard Deviation = 2.0% • Cp=Cpk = 4.17 • >”6σ” process
~ 10% can be rejected “σ < 2” > 40% can be rejected PQRI Blend Uniformity Working Group Report Combined Criteria
Other Challenges Hussain, A.S. Biopharmaceutics and Drug Product Quality: Performance Tests for Drug Products, A Look Into the Future. USP Annual Scientific Meeting"The Science of Quality“. September 26–30, 2004
Other Challenges Hussain, A.S. Biopharmaceutics and Drug Product Quality: Performance Tests for Drug Products, A Look Into the Future. USP Annual Scientific Meeting"The Science of Quality“. September 26–30, 2004
Other Challenges • “Root cause unknown” • Common cause Vs. Special Cause? • The Common cause trap • “Zero tolerance” (e.g., OOS during stability testing – when is this simply a sample size issue?) • Confounded metrics (e.g., dissolution Q values instead of a “rate” metric - % label amount confounded with content uniformity) • Our decision system for mass production is based on a “compounding pharmacy” model • Mind set – we are not learning from other sectors
Pharmaceutical Challenges in moving towards 6 Sigma? • Are we measuring the “right” characteristics? • Are our measurement systems capable? • Are we establishing the “right” acceptance criteria for the clinical trial product? • The process is “approved” and “validated” – why bother? • Zero defect mindset – better not to know the “sigma”? • Reducing variability can result in a change in regulatory acceptance criteria to keep the system at a low “sigma” value – how else would you know if your quality system is working? For some products we may already be at Six Sigma, but we may not be able to prove it?
Quality – Clinical Gap! CMC & CGMP Commitments* CMC – CGMP Gap* “Market Failure”! “Corrective Actions” the only * leverage for continuous improvement Specification – Capability Gap* http://www.ge.com/sixsigma/SixSigma.pdf *Opportunity for continuous improvement* Challenges to overcome! The Pharmaceutical Quality: Challenges and Opportunities
What are the steps necessary for the pharmaceutical continuous improvement journey in the 21st Century?
Six Sigma DFSS
The Goal and Characteristics of Pharmaceutical Quality Decision System Goal • “The quality of drug substances and drug products is determined by their design, development, in-process controls, GMP controls, process validation, and by specifications applied to them throughout development and manufacture.” Characteristics Life-cycle ICH Q6A
ICH Q6A Decision Characteristics Specifications In process controls Development Design Process validation GMP Controls “…where the provision of greater understanding of pharmaceutical and manufacturing sciences can create a basis for flexible regulatory approaches.” What is the ICH Q8 Opportunity?
Steps Necessary • Ask the “right questions” • Begin with end in mind – Intended use • System based (connecting the key disciplines and regulatory submission sections) • Facilitate structured product development process, yet not dictate a specific process • Leverage pre-approval changes & “bridging studies” • Cumulative – and support use prior knowledge • Scientific hypothesis format
Constructing and Justifying “Design Space” • Build on “minimal” expectations such as stability, bioavailability, and other performance assessment to “test of hypothesis” • Scientific risk assessment • Opportunity to demonstrate the level of process understanding and reliability of proposed “design space”
Steps Necessary • Routine production • Process control – stable process in a state of control • Control charts of variables (not attributes) • Target value +/- Upper and Lower Limits • Process capability analysis • Not “hypothesis testing” on every lot • Specification and Process Validation • Hypothesis testing • Parametric or non parametric tolerance interval • No penalty for higher sample size • Continuous quality verification
Specifications, Standards and Control Limits If, Specification = Standards (no room for risk based decision) • Specification = Standard • Non-conformance rejection or recall • Control limit • Target value • Common cause variability • Alert limit • Potential “Special cause” – investigate, take necessary action to prevent OOS Control Limit Alert Limit
Scope of the Proposed Guideline (ICH Q10) • Comprehensive quality system for product life cycle that • Complements existing GMP’s • Focuses on those elements that facilitate application of ICH Quality Guidelines (e.g., ICH Q8), and • Facilitates continuous improvement in pharmaceutical manufacturing
Proposed Guideline • The starting point for a harmonized pharmaceutical quality system (QS) will be ISO 9000 standards • Key Considerations • The pharmaceutical context of elements that define the QS framework will be explained • Elements of the QS that link to science will be identified and enhanced • for achieving the integrated systems approach to quality emphasized in the ICH vision • to facilitate continuous improvement over a product life cycle
Product quality and performance achieved and assured by design of effective and efficient manufacturing processes Product specifications based on mechanistic understanding of how formulation and process factors impact product performance An ability to effect continuous improvement and continuous "real time" assurance of quality Develop effective CAPA – eliminate “special cause” variability Utilize Process capability analysis – reduce/control “common cause” variability Identify, understand and acquire ability to predict critical to quality attributes (CQA) (product/process/measurement) Focus on the “critical few” Establish CQA target values and acceptable variability around the target value Utilize a monitoring system that demonstrates “state of control” preferably based on critical material attributes (not just end product testing) Goals & Characteristics
Summary • Background & Terminology • Pharmaceutical product and process quality – what is the current “sigma”? • Challenges in moving towards “6-sigma” levels? • What are the steps necessary for the pharmaceutical continuous improvement journey in the 21st Century?