Download
1 / 40
400 likes | 613 Views
Emission Accounts Technical Workshop on the Preparation of Water Accounts in Latin America Chile, 1-4 June, 2009. Jeremy Webb United Nations Statistics Division. Outline. What do emission accounts measure? Concepts The standard tables of SEEAW Policy uses and indicators (e.g. Austria).

E N D
Emission AccountsTechnical Workshop on the Preparation of Water Accounts in Latin AmericaChile, 1-4 June, 2009 Jeremy Webb United Nations Statistics Division
Outline • What do emission accounts measure? • Concepts • The standard tables of SEEAW • Policy uses and indicators (e.g. Austria)
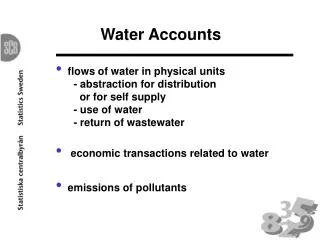
What do emission accounts measure? Emission accounts describe, in physical units, flows of pollutants added to wastewater as a result of production and consumption, and flowing into water resources either directly or through the sewage network.
Why compile emission accounts? Emission accounts provide information on: • Which activities are responsible for the emission • How much is being emitted • Where this is being emitted They are useful for designing policies aimed at reducing pressure on the environment
Why compile emission accounts? Since they are linked to the economic accounts (via the hybrid tables), they allow for • the formulation of cost-effective policies aiming at reducing emissions • the evaluation of the economic impacts of policies aiming at reducing emissions
Basic concepts and definitions • Emissions to water are defined as direct release of a pollutant to water as well as the indirect release by transfer to an off-site wastewater treatment plant. • The SEEAW focuses only on the release of substances into water resources through the (direct and indirect) discharge of wastewater into water resources. • The direct discharge of heavy metals and hazardous waste not through wastewater is not covered in the water emission accounts but in the waste accounts.
Wastewater and pollutants pathways Rest of the world Households Agriculture Other industries Sewerage Water resources and the sea
Basic concepts and definitions Point source emissions are those emissions for which the geographical location of the discharge of the wastewater is clearly identified e.g. emissions from wastewater treatment plants, power plants, other industrial establishments They are generally easier to measure since the point of emission to the water resources is clearly identified
Basic concepts and definitions Non-point (or diffuse) sources of pollution are sources without a single point of origin or a specific outlet into a receiving water body. Pollutants are generally carried off the land by storm-water run-off or may be the result of a collection of individual and small scale polluting activities which for practical reasons cannot be treated as point sources of pollution. Commonly used categories for non-point sources include agriculture and urban areas.
Basic concepts and definitions Gross emissions are the pollutants added to the water by an activity, assessed at the point where the wastewater leaves the activity's site (or the dwelling, in the case of households). Net (or final) emissionscorrespond to the pollutants discharged into water resources after treatment. Net emissions= grossemissions if there is no treatment of wastewater
Emission accounts Industries, households and the “rest of the world” are identified by columns They record the pollution added to water by an economic unit (and not the total pollution discharged with wastewater)
Rest of the world Households Agriculture Other industries Sewerage Water resources and the sea Emission accounts 185 30 90 25 5 95 185 30 95 5 90 25 20
Emission accounts by ISIC 37 Now we can reallocate the emissions by ISIC 37 to the activity responsible for the emission 20 20
Rest of the world Households Agriculture Other industries Sewerage Water resources and the sea Emission Accounts 185 30 90 25 95 5 1 19 26 109 185 30 95 5 90 25 20
Urban runoff Urban run-off: that portion of precipitation on urban areas that does not naturally percolate into the ground or evaporate, but flows via overland flow, underflow, or channels or is piped into a defined surface water channel or a constructed infiltration facility. It is generally highly polluted and there is an increasing awareness in the potential danger of discharging it into the environment without treatment.
Urban runoff Emissions to water in the urban runoff are allocated to the Sewerage industry, ISIC 37 since this is the economic unit responsible for its collection and discharge
Reallocation of emissions • Use average removal rates (e.g. per category of WWTP) or • Use information of known removal rates per WWTP
Supplementary information (1) Emission to water resource: • Surface water (and further disaggregation into artificial reservoirs, lakes, rivers etc.) • Groundwater Sludge production: • Total sewage sludge produced (vol.) • Load in total sewage sludge
Diffuse emissions • European Harmonised Procedures for Quantification of Nutrient Losses from Diffuse Sources - EUROHARP • Web: http://euroharp.org/index.htm
Waste Water Emissions in Austria Courtesy of Michael Nagy Umweltbundesamt Austria (Federal Environment Agency)
Information needs • Policy relevant questions: • Status, trends, forecasts on emissions and pollution control • Fulfillment of European reporting exercises: • EU-Urban Waste Water Treatment Directive • EU-Water Framework Directive • EPER PRTR • Eurostat / OECD Joint Questionnaire on Inland Waters
Policy demands • “Classical” policy questions: • What is the % of population connected to collecting system and urban waste water treatment plants? • Is pollution from urban areas and industry increasing or decreasing? • New Policy questions • Mostly related to economic considerations (more about these later)
“Classical” indicators • Population connected to collecting system and waste water treatment plants • Waste water quantities (m³) discharged (urban / industry) • Organic pollutants (BOD / COD) discharged (urban / industry) • Nutrients(Nitrogen and Phosphorus) discharged (urban / industry) • Dangerous substances
Characteristics of “classical” waste water indicators • Focus on point sources discharging into surface waters • Policy relevant questions were related to the facts that: • pollution of surface waters stemmed mainly from point sources • big potential for improvement of treatment technologies and production processes • Indicators have been the basis for regulations on limitation of discharged pollutants (production sector specific), investments, subsidiesand other measures • Indicators have been used for monitoringof progress and assessment of achievement of policy goals
New policy questions • Which actions are the most cost-effective? • What are the costs to reduce 1 unit of a pollutant discharged from agriculture/industry/urban areas....? • What are the socio-economic costs of polluted waters? • Health of society • Economic activities dependent from clean water e.g. fishing, water supply, tourism,... • Other (uncertain) effects
New waste water indicators • Better consideration of diffuse pollution to consider ALL sources of pollution • Industry aggregates link with economic indicators • Goals • identify cost-efficient measures • assess socio-economic effects • monitor effects of changed production-technologies
COD emissions, direct discharges COD Households Manufacture of pulp, paper and paper products (21) Manufacture of chemicals and chemical products (24) Sewage and refuse disposal, sanitation and similar activities (90)
Nitrogen emissions, direct discharges Nitrogen (total) Agriculture, hunting and related service activities (01) Forestry (02) Households
Chrome emissions. direct discharges Chrome Manufacture of other non-metallic mineral products (26) Manufacture of basic metals (27) Manufacture of textiles (17) Leather (19)
Data collection • A lot of data is already collected: • National Accounts • National reports on the status of the environment • European reporting obligations (WFD, UWWTD, EPER, etc.) • Austrian Emissions Inventory: updated once a year with data from regional authorities (for each individual “significant” discharger)
To further develop emission accounts in Austria • Demonstrate usefulness to policy makers (e.g. for purposes of EU-WFD) • Use already existing data collections as far as possible (usually legally binding) • Modify data collections (and their legal basis) where this is necessary (coverage, sector-specific aggregation)
Outlook for Austria • Emission accounts project : • Use of data of the Austrian Emission Inventory on Surface Waters (developed according to EU-WFD, covers “significant” point sources and diffuse sources) for NAMEA-Water Emissions (2004-2005 data) • Develop methodology for consistent time-series based on WFD-data • Overall goal: Regular update on the basis of WFD-data
Conclusions • Emission accounts are addressing new policy-relevant questions • Existing data collection systems may contain useful information (e.g. Emissions Register) • May need to set-up specific data collections • Promotion of usefulness of (emission) accounts is very important. They will aide: • Understanding of the costs and benefits of measures • discussion with different stakeholders (e.g. agriculture versus industry as polluters of waters) • monitoring of environmental efficiency • definition of policy goals
Contact details Jeremy Webb Statistician (Environment Statistics) United Nations Statistics Division New York 10017, USA Room DC2 1410 Phone: +1 212 963 8564 Fax: +1 212 963 0623 Email: webbj@un.org Michael Vardon Adviser on Environmental-Economic Accounting United Nations Statistics Division New York 10017, USA Room DC2 1532 Phone: +1 917 367 5391 Fax: +1 212 963 1374 Email: vardon@un.org Michael Nagy Unit for Data Management & Reporting Umweltbundesamt Austria (Federal Environment Agency) Spittelauer Laende 5 1090 Vienna Phone: +43 1 31304 3490 Email: michael.nagy@umweltbundesamt.at