
DEBUG
E N D
Presentation Transcript
gdb (GNU Debugger) • Debuggers are programs which allow you to execute your program in a controlled manner, so you can look inside your program to find a bug. • gdb is a reasonably sophisticated text based debugger. It can let you: • Start your program, specifying anything that might affect its behavior. • Make your program stop on specified conditions. • Examine what has happened, when your program has stopped. • Change things in your program, so you can experiment with correcting the effects of one bug and go on to learn about another. • SYNOPSIS gdb [prog] [core|procID]
gdb • GDB is invoked with the shell command gdb. • Once started,it reads commands from the terminal until you tell it toexit with the GDB command quit. • The mostusual way to start GDB is with one argument or two, specifying an executable program as the argument: obelix[4] > gdb program • You can also start with both an executable program and acore file specified: obelix[5] > gdb program core • You can, instead, specify a process ID as a second argument, if you want to debug a running process: obelix[6] > gdb program 1234 would attach GDB to process 1234
Compiling with the –g Option • To use gdb best, compile your program with: gcc –g –c my_math.c gcc –g –c sample.c gcc –o sample my_math.o sample.o or: gcc –o sample -g my_math.c sample.c • That is, you should make sure that –g option is used to generate the .o files. • This option tells the compiler to insert more information about data types, etc., so the debugger gets a better understanding of it.
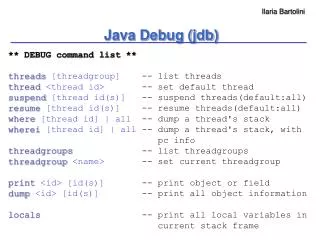
Common Commands for gdb • Here are some of the most frequently needed GDB commands: b(reak) [file:]function Set a breakpoint at function (in file). r(un) [arglist] Start program (with arglist, if specified). bt or where Backtrace: display the program stack; especially useful to find where your program crashed or dumped core. print expr Display the value of an expression. c Continue running your program (after stopping, e.g. at a breakpoint). n(ext) Execute next program line (after stopping); step over any function calls in the line. s(tep) Execute next program line (after stopping); step into any function calls in the line. help [name] Show information about GDB command name, or general information about using GDB. q(uit) Exit from GDB. l(ist) print the source code
How useful are debuggers? • Debuggers can be great for seeing how small programs execute • Great for certain types of problems • Identifying the line on which the program crashes • Seeing state of procedure stack at crash • Less useful for non-crashing programs • Disadvantages of debuggers • Not available on some systems • System-dependent user interface • Too many low-level details • Try debugging linked lists • Clicking over statements is tedious • Deal poorly with large amounts of data • Difficult to find intermittent bugs • Debuggers are an important tool, but not the only, or even most important one for debugging programs
How useful are debuggers? • Often more useful to dump information to screen • Easy to scan large amount of data • Only output relevant data • Debugging code can be left in program • Use #ifdef’s and #defines to comment it out • Or just plain if statements, if you trust the compiler • Debugging sessions are transient • Difficult bugs to find are ones where the program works for most of the input data, but some small part causes problems • Bug may depend on combination of conditions • Looking at a screen-full of data can allow you to reason backward
Backward Reasoning • Debugging is the process of reasoning backwards from the undesired behaviour (bad output, spectacular crash, running forever) to the cause of the behaviour • Debugging is backward reasoning • Like solving murder mysteries • We have a dead body. How were they killed? • Bugs show us a gap between how we think the program behaves and how it actually behaves • Once we have identified the reason for the problem, fixing it is usually relatively easy • But sometimes bugs reveal fundamental flaws in our whole design
Some debugging tips • Read “The practice of programming” by Kernighan and Pike • Look for familiar patterns • int n; • scanf(“%d”, n); • if ( x = y ) • double d = 3.14159265357; • int i = 1; • printf(“%d %f”, d, i); • You will make these and similar mistakes time and time again
Some debugging tips • Examine the most recent changes • You should write your program incrementally • If a bug appears, it should be because of a recent change • Finding older bugs is very difficult • You should never write a big bunch of code and then try to debug it into workingness. • Need to test your program continuously as you develop it. • Aside: • Extreme programming (XP) is a technique for smallish groups developing software • One aspect of XP is developing test cases in parallel with the code, and extending the code incrementally to pass more and new test cases • Continuous retesting as part of the process • Basically just (un)common sense
Some debugging tips • Don’t make the same mistake twice • After you fix a bug, ask whether you made the same mistake elsewhere • Many bugs arise from a misunderstanding of how the program behaves for ( i = 1; i < argc; i++ ) { if ( argv[i][0] != ‘-’ ) /* options finished */ break; switch ( argv[i][1] ) { case ‘o’: outname = argv[ i ]; break; /*output filename*/ case ‘f’: from = atoi(argv[ i ]); break; case ‘t’: to = atoi(argv[ i ]; break } } $ myprog -ofilename Output filename always has prefix “-o”. Why? What other problems are there?
Some debugging tips • Debug it now, not later • Tempting to press ahead if bug seems unimportant • But old bugs are the hardest to find • May never find bug until after software is delivered • Mars Pathfinder • Spacecraft’s computers reset every day • Bug tracked down to something seen in testing • Engineers had been too busy working on something else • Fixing bugs over a radio link to Mars is more difficult • Also very important for embedded software • Usually recalling large numbers of consumer devices because of software bugs is not practical
Some debugging tips • Get a stack trace • Debuggers can be tedious to work with • But stack traces are the most useful debugging information when a program crashes spectacularly • Read and think before typing • Debugging is fundamentally about understanding the difference between what you think you asked the computer to do and what you actually asked it to do • Get a cup of coffee • Explain your code to someone else • Often end up explaining bug to yourself • Consider using cardboard cutout
Difficult Bugs • Make the bug reproducible • Most difficult bugs to fix are those that are difficult to repeat • Big reason why concurrent programming is so difficult • Find input and parameter settings that cause the bug to appear every time • Will need to reproduce bug again and again • If bug cannot be made reproducible, that is also information • Divide and conquer • Reduce the size of the input required to trigger bug • Make test case as small as possible • Use binary search • Throw away half the input • See which half of the input causes the bug • Repeat
Difficult Bugs • Check real numbers • Round numbers in programs rarely appear randomly • Eg program dropping characters apparently at random • Discovered actually one character every 1023 bytes • 1023 is suspiciously close to 1024 a very round number • Check program for appearances of constant 1023 or 1024 • Found 1024 byte buffer • Last character being overwritten by ‘\0’ character • This bug would be almost impossible to find with a debugger • Always be suspicious of round numbers
Difficult Bugs • Display output • Write key information to the screen • Use %p for pointers • Watch out for pointer values that don’t look like addresses • Small values • Odd numbers for non-char pointer • Addresses usually fall within a few ranges • Write out when program reaches key places • Use indentation to make output easier to read • Make sure all debugging information goes to stderr • stdout is buffered • Consider writing a log file • or just redirect stderr to a file • myprogram 2> logfile
Difficult Bugs • Write self-checking code • If you believe something is true, test that it is true • Use C’s assert feature • #include <assert.h> • assert(p != NULL); • Consider writing your own functions to test more complicated conditions • Don’t throw away all debugging code after the bug is fixed • assert can be turned off without removing code • pass –DNDEBUG to compiler • but consider leaving assertions or other debugging code even in production versions
Difficult Bugs • Draw a picture • Especially useful for debugging linked data structures • Can dump pointer values to the screen • Histograms can show statistical anomalies in data • Crude ones with ASCII art • Use tools • Use grep, diff, etc to look through large volumes of debugging output.