Download
1 / 19
190 likes | 216 Views
This article discusses the importance of performance measures for telecom universal service programs and provides 7 steps for developing effective measures. It also highlights the need to analyze causation, measure cost-effectiveness, and include hidden costs in assessing program outcomes.

E N D
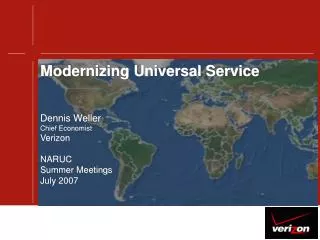
Good Intentions vs. Real Accomplishments: Effective Performance Measures for Telecom Universal Service ProgramsJerry ElligSenior Research Fellow
Universal Service 2004 Disbursements • High-cost carriers ($3.5 billion) • Low-income households ($759 million) • Schools/libraries ($1.2 billion) • Rural health care ($15 million) Source: FCC, Trends in Telephone Service (June 2005), Table 19.1.
Why discuss universal service measures? • Good case study in development of performance measures • Programs are intended to produce significant economic, social, educational, and health benefits • Programs widely criticized for lack of performance measures and other management problems
Ineffective programs arguably a bigger danger than waste/fraud/abuse Total schools/libraries commitments thru Oct 2005: $15 billion Waste/fraud/abuse recovery actions (as of 2004): $36 million “Questionable” funding under investigation (2005): $200 million Each 1% of funding spent lawfully but ineffectively: $150 million
7 steps toward effective measures • Articulate “logic model” • Identify specific, ultimate outcomes • Identify intermediate outcomes (if needed) • Develop measures for outcomes • Analyze causation • Measure cost-effectiveness, not just efficiency • Include hidden costs
1. Implicit “Logic Model” • Programs cause improvement in access/affordability • Improvement in access/affordability causes increase in subscribership or connectivity • Increased subscribership/connectivity causes economic, social, educational, health benefits
Intermediate Measures – Telephone • # and % of target population with phone service available • # and % of target population that spends less than a designated percentage of income on phone service • # and % of target population subscribing to phone service who would not subscribe in the absence of the program
Intermediate Measures – Internet • # and % of people served by facilities in locations where the service is available • # and % of people served by facilities that spend less than a designated % of budget on service • # and % of people served by facilities that would not have been connected to specified services in the absence of the program
Why subscribership is not a sufficient measure High subscribership = high availability Low subscribership ≠ low availability High subscribership ≠ affordability Low subscribership ≠ lack of affordability
5. Analyze causation How much of the observed change in the outcome can be attributed to the program after adjusting for other factors that affect the outcome? -Simple calculations -Control and treatment groups -Econometric analysis
Simple calculations • Select a benchmark for affordability • Calculate # and % of consumers paying less than the benchmark • Calculate the prices they would pay in the absence of the subsidy • Calculate # and % of consumers paying less than the benchmark if prices were not subsidized • Difference is the change in outcome attributable to subsidies Note: Some subsidies inflate costs
Econometric analysis • Subsidies for local telephone service have little effect on subscribership • High cost program costs $5-10k per additional subscriber • Low income programs cost $1500-2200 per additional subscriber
6. Cost-effectiveness measures Cost of program divided by # of successful outcomes • What does it cost to make service affordable for an additional household? • What does it cost to induce an additional household to subscribe? • What does it cost to achieve a specified amount of change in student performance? • What does it cost to improve a specified health outcome by a specified amount?
7. Incorporate all economic costs Deadweight loss = Value of service that consumers forego, plus operating profits that producers forego, because increased price reduces use of the service Universal service taxes services with elastic demand to subsidize services with inelastic demand
Explicit + Hidden CostsSource: Jerry Ellig, “Costs and Consequences of Federal Telecommunications Regulation,” 58 Federal Communications Law Journal 37 (Jan. 2006).
What do good performance measures do? • Explicitly state desired outcomes • Use meaningful outcome measures that reflect causation • Examine cost-effectiveness in terms of outcomes • Include hidden costs when assessing cost-effectiveness
For more information … More detail on these concepts and examples can be found in a series of public interest comments filed with the FCC by Maurice McTigue and Jerry Ellig, available at http://www.mercatus.org/Publications/pubID.1317/pub_detail.asp