Download
1 / 20
200 likes | 307 Views
Jon R. Gabel Senior Fellow National Opinion Research Center at the University of Chicago. Trends in Employer-Based Health Insurance. Presentation Objectives. To document the state of employer-based health benefits, 2009, in the USA and California

E N D
Jon R. Gabel Senior Fellow National Opinion Research Center at the University of Chicago Trends in Employer-Based Health Insurance
Presentation Objectives • To document the state of employer-based health benefits, 2009, in the USA and California • To examine changes in benefits over the last ten years in the USA and California • To compare coverage for large and small employers • To examine the legacy health care system if health reform fails.
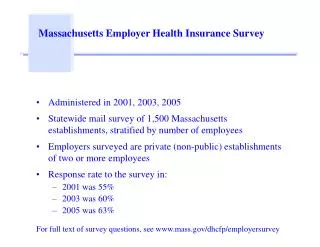
KFF/HRET Health Benefits Survey 2009 • Telephone survey of 2,054 randomly selected public and private employers • National Research conducts interviews with employee benefit managers from Jan. 2009 to May 2009 • Response rate of 47 percent in 2009 • Survey conducted by HIAA 1987-1991 and KPMG 1991-1998 • Use of statistical weights • Employer-based statistics • Employee-based statistics
California Health Benefits Survey California HealthCare Foundation/NORC • Random survey of 827 private employers with 3 or more workers • Questions often identical to national survey • Conducted from April 2009-July 2009 • Survey conducted since 2000 • Use of statistical weights • Sampling error of 3.4 percent with full sample.
Increases in Health Insurance Premiums Compared to Other Indicators, 1988-2009 13.9%† * Estimate is statistically different from the previous year shown at p<0.05. No statistical tests were conducted for years prior to 1999. † Estimate is statistically different from the previous year shown at p<0.1. No statistical tests were conducted for years prior to 1999. Note: Data on premium increases reflect the cost of health insurance premiums for a family of four. Source: Authors calculations from KFF/HRET Survey of Employer-Sponsored Health Benefits, 1999-2009; KPMG Survey of Employer-Sponsored Health Benefits, 1993, 1996; The Health Insurance Association of America (HIAA), 1988, 1989, 1990; Bureau of Labor Statistics, Consumer Price Index (U.S. City Average of Annual Inflation (April to April), 1988-2009; Bureau of Labor Statistics, Seasonally Adjusted Data from the Current Employment Statistics Survey (April to April), 1988-2009.
Increases in California Health Insurance Premiums Compared to Overall Inflation, 1999-2009 • Health insurance premiums in California grew by 7.5% in 2009, statistically unchanged in recent years. • Premiums continue to rise at much more than the California inflation rate. * Estimates are statistically different from the previous year shown. Sources: CHCF/NORC California Employer Health Benefits Survey: 2007-2009; CHCF/HSC California Employer Health Benefits Survey: 2005-2006; CHCF/HRET California Employer Health Benefits Survey: 2004; Kaiser/HRET California Employer Health Benefits Survey: 1999-2003; California Division of Labor Statistics and Research, Consumer Price Index, California Average of Annual Inflation (April – April) 1999–2009.
Cumulative Changes in Health Insurance Premiums, Overall Inflation, and Workers’ Earnings 2000 - 2009 Source: Author’s Calculation of KFF/HRET Survey of Employer-Sponsored Health Benefits, 2001-2009; Bureau of Labor Statistics, Consumer Price Index, U.S. City Average of Annual Inflation (April to April), 2001-2009; Bureau of Labor Statistics, Seasonally Adjusted Data from the Current Employment Statistics Survey (April to April), 2001-2009.
Average Annual Firm and Worker Premium Contributions and Total Premiums for Covered Workers for Single and Family Coverage, by Plan Type, 2009 HMO $4,878 $13,470 PPO $4,922 $13,719 POS $4,835 $13,075 HDHP/SO $3,986 $11,083 ALL PLANS $4,824 $13,375 * Estimate is statistically different from All Plans estimate by coverage type (p<.05). Source: Kaiser/HRET Survey of Employer-Sponsored Health Benefits, 2009.
Average Monthly Premiums, by Plan Type, 2009 • Premiums for most plan types in California were comparable to premiums nationally. • California PPOs were more costly for both single and family coverage than in the rest of the nation. Single Family * Estimates are statistically different between California and US. Source: CHCF/NORC California Employer Health Benefits Survey: 2009; Kaiser/HRET Employer Health Benefits Survey: 2009
Health Plan Enrollments for Covered Workers, by Plan Type, 2001 - 2009 California • California workers have been consistently more likely to enroll in HMOs than covered workers nationally. Conversely, PPOs are more popular in the U.S. than in California. • Enrollment in high deductible plans with a savings option has changed little since 2007. U.S. * Distribution is statistically different from previous year shown. Note: Conventional plan enrollment in California in 2001, 2005 and 2007 is less than 1%. Due to the addition of HDHP in 2006, no test was conducted comparing 2006 with 2005. Sources: CHCF/NORC California Employer Health Benefits Survey: 2007-2009; CHCF/HSC California Employer Health Benefits Survey: 2005-2006; CHCF/HRET California Employer Health Benefits Survey: 2004; Kaiser/HRET California Employer Health Benefits Survey: 2001-2003; Kaiser/HRET Employer Health Benefits Survey: 2001-2009.
Average Monthly Worker Contribution, 1988-2009 * Estimate is statistically different from the previous year shown at p<.05. No statistical tests were conducted for years prior to 1999. Source: Kaiser/HRET Survey of Employer-Sponsored Health Benefits, 1999-2009; Health Insurance Association of America (HIAA), 1988.
Percentage of Premium Paid by Covered Workers, 1988-2009 * Estimate is statistically different from the previous year shown at p<.05. No statistical tests were conducted for years prior to 1999. Source: Kaiser/HRET Survey of Employer-Sponsored Health Benefits, 1999-2009; Health Insurance Association of America (HIAA), 1988.
Increases in Overall Deductible (All Plans),2005-2009 Includes plans with and without deductibles Source: Authors calculations from Kaiser/HRET Survey of Employer-Sponsored Health Benefits, 2005-2009.
Percentage of Covered Workers Enrolled in a Plan with General Annual Deductible of $1,000 or More, for Single Coverage , by Firm Size, 2006-2009 • Estimate is statistically different from the previous year shown at p<.05. • Note: These estimates include workers enrolled in HDHP/SO and other plan types. Because we do not collect information on the attributes of conventional plan types, to be conservative, we concluded that workers in conventional plan types do not have a deductible of $1,000 or more. Because of the low enrollment in conventional plans, the impact of this assumption is minimal. Average annual general health plan deductible for PPOs, POS plans and HDHP/SOs are for in-network services. • Source: Kaiser/HRET Survey of Employer-Sponsored Health Benefits, 2006-2009.
Percentage of Covered Workers in Partially or Completely Self-Funded Plans, By Firm Size, 1999-2009 * Estimate is statistically different from the previous year shown at p<.05. Source: Kaiser/HRET Survey of Employer-Sponsored Health Benefits, 1999-2009.
Percentage of Workers Covered by Their Employer’s Health Benefits, in Firms Both Offering and Not Offering Health Benefits, by Firm Size, 1999-2009 # Year-to-year estimates are not significantly different at p<.05. However, there is a significant change between 2000 and 2005 for All Firms and All Small Firms at p<.05. Source: KFF/HRET Survey of Employer-Sponsored Health Benefits, 1999–2009.
Tighter Managed Care Networks* Consumer-Driven Health Plans Higher Employee Cost Sharing* Disease Management Programs* Distribution of Firms’ Opinions on the Effectiveness of the Following Cost Containment Strategies, 2009 *Distributions are statistically different between All Small Firms and All Large Firms within category (p<.05). Note: Distributions are among all firms both offering and not offering health benefits. Source: Kaiser/HRET Survey of Employer-Sponsored Health Benefits, 2009.
Likelihood of California Employers Making Selected Changes Next Year Increase the Amount Employees Pay for… • Twenty-one percent of employers in California reported that they are very likely to increase the amount employees pay for health insurance premiums in the coming year. Source: CHCF/NORC California Employer Health Benefits Survey: 2009
Summary • Premium increases are moderate (five percent) – but six percentage points more than overall inflation. • Average deductible has roughly doubled since 2005. • 70 percent increase in overall deductibles for small firms since 2007. • Some indications that many small employers in California are considering dropping coverage.
Legacy System • The cost of family coverage should reach $25,000 before the end of the decade. • Reasons to believe higher premium increases are in the near future: • H1NI • FEBHP shows 8.5 percent increase. • Benefit consulting firms forecasting upturn. • Seven year itch. • Urban Institute forecasts 13.2 million persons will lose employer-based insurance and the number of uninsured will rise to 57 million.