Download
1 / 15
150 likes | 259 Views
Review key concepts like mean, standard deviation, and median. Practice z-scores, proportions, and distribution visualization. Engage with worksheets and discussions. Enhance understanding of data analysis.

E N D
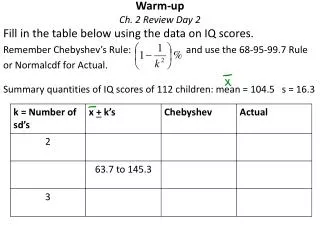
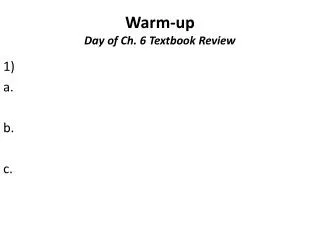
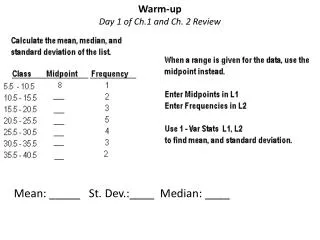
Warm-upDay 1 of Ch.1 and Ch. 2 Review Mean: _____ St. Dev.:____ Median: ____
Answers to Normal Distribution Worksheet 1 Part A – 1) 68% 2) normalcdf (0, 40, 52, 7) = 4.3% 3) normalcdf(45,45.99,52,7) = 0.037 = 3.7% OR normalpdf(45,52,7) =0.0345 = 3.5% 4) normalcdf (60, 200, 52, 7) = 12.7% Part B – 1) Both graphs would have a normal distribution, but the density curve for B would be taller and less wide due to the smaller standard deviation. The center would be slightly more to the right because the mean for B is 54 in comparison to 52 for A. 2) 0.3% 3) 11.5% 4) 80.5%
Normal Distribution Worksheet 2 • 1.98% • 1.15% • 10% are borderline hypertensive 10.6% are hypertensive.
Z-score Z-scores (for normal distribution) describe how many standard deviations (σ) a piece of data is from the mean(μ). The z-score can also be used to find the proportion of values above or below the z-score using normalcdf (z-score of LB, z-score of UB) invNorm can find the z-score when the percentile is given invNorm(percentile)
Practice with z-scores and finding proportions. • A distribution of quiz scores has a mean of 35 and an standard deviations of of 4. Sara received a 40. • What is her z-score? • What is her percentile rank compared to the rest of the class? 2) In a normal distribution with mean 25 and standard deviation 7, what proportion of the data are less than 20?
Notebook Check and Textbook Review Work in Silence for 30 minutes. This is a participation grade. After the 30 minutes you can discuss the answers at your table before I put them up on the SmartBoard. Worksheet #3 pg 24 and 25 AP #1 – 5; pg 96 E#75 – 79. • 1.0 Types of Data and Graphs + • 1.1 Data Exploration • 1.2 Intro. to Summary Statistics • 2.1 Visualizing Distributions • 2.2 Graph Displays of Dist. • 2.3 Measures of Center • 2.4 Summary Statistics • 2.1 to 2.4 Bingo • 2.5 Normal Distribution + • Worksheet 3 and 4 + Notes with warm-up 11 pts =77pts (8pts notes, 3 pts warm-up = 11) Ch. 2 Definitions ( 20pts) + means warm-up on separate sheet
Worksheet #3 Solutions • a) 99.8% b) 21.3% • a) 91.4% b) above 23.5 cm c) below 22.1 d) between 23.5 and 22.1 cm 3. a) 42.1% b) above 218.77 mg/dL 4. a) 88.3% b) below 30.7 mg/dL 5 a) 0.5% ; b) 24.5 oz c) Q1 = 20.7 oz, Q3 = 28.2 oz IQR = 7.5 oz
pg 24 and 25 AP #1 – 5 AP1. B AP2. E AP3. B AP4. A AP5.
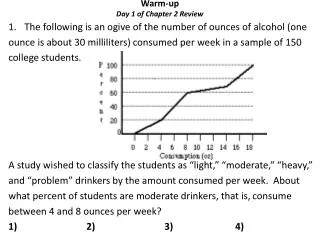
Common Quiz Mistakes • Describe the distribution, always answer in sentences and remember SOCS. • Don’t forget titles on your data displays every time. • For the o-give or cumulative frequency graphs. The first dot at zero means no data is there. Always go to the next dot to see where the data begins. There were zero golfers age zero at the tournament. The youngest golfers were 19 yrs old.