Download
1 / 1
10 likes | 182 Views
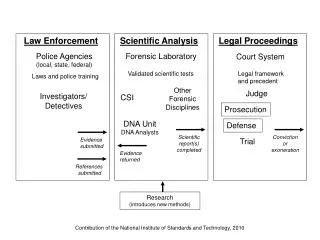
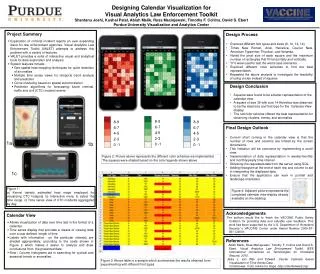
Designing Calendar Visualization for Visual Analytics Law Enforcement Toolkit Shantanu Joshi, Kushal Patel, Abish Malik, Ross Maciejewski , Timothy F. Collins, David S. Ebert Purdue University Visualization and Analytics Center. Project Summary

E N D
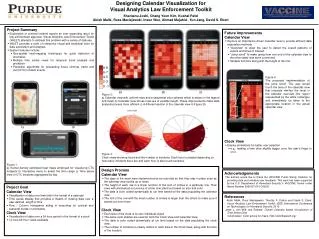
Designing Calendar Visualization for Visual Analytics Law Enforcement Toolkit Shantanu Joshi, Kushal Patel, AbishMalik, Ross Maciejewski, Timothy F. Collins, David S. Ebert Purdue University Visualization and Analytics Center • Project Summary • Exploration of criminal incident reports an ever expanding issue for law enforcement agencies. Visual Analytics Law Enforcement Toolkit (VALET) attempts to address this problem with a variety of features. • VALET provides a suite of interactive visual and analytical tools for data exploration and analysis • System features include: • Geo-spatial heat-mapping techniques for quick detection of anomalies • Multiple time series views for temporal trend analysis and prediction • Crime clustering based on spatial autocorrelation • Prediction algorithms for forecasting future criminal, traffic and civil (CTC) incident events • Design Process • Explored different font types and sizes (8, 10, 12, 14) • Times New Roman, Arial, Helvetica, Courier New, American Typewriter, Thonburi, and Veranda. • Noted the pixel size of each square and the maximum number of rectangles that fit horizontally and vertically. • “0”’s were used to test the worst case scenarios. • Explored different color schemes to find the best representation. • Repeated the above analysis to investigate the feasibility of using circles instead of squares • Design Conclusion • Squares were found to be a better representation of the calendar view. • A square of size 39 with size 14 Helvetica was observed to be the ideal size and font type for the Calendar View display. • The red color scheme offered the best representation for observing clusters, trends, and anomalies • Final Design Outlook • Current short coming in the calendar view is that the number of rows and columns are limited by the screen dimensions. • This limitation will be overcome by implementing a scroll view. • Implementation of data representation in weekly/monthly and monthly/yearly time interval • Obtaining the requested data from the server using SQL. • Adding histogram at the end of each row and column to aid in interpreting the displayed data. • Ensure that the application can work in portrait and landscape orientation. 1a 1b 1c Figure 1: a) Kernel density estimated heat maps employed for visualizing CTC hotspots. b) Interactive menu to select the time range. c) Time series view of CTC incidents aggregated by day. Acknowledgements The authors would like to thank the VACCINE Public Safety Coalition for providing data and valuable user feedback. This work has been supported by the U.S. Department of Homeland Security’s VACCINE Center under Award Number 2009-ST-061-CI0001. • Calendar View • Allows visualization of data over time laid in the format of a calendar. • Time series display that provides a means of viewing data over a user defined length of time • Labels with information on the particular crime(s) are shaded appropriately, according to the scale shown in Figure 2 which makes it easier to analyze and draw conclusions from the presented data • Row / Column histograms aid in searching for cyclical and seasonal trends or anomalies. References Abish Malik, Ross Maciejewski, Timothy F. Collins and David S. Ebert. Visual Analytics Law Enforcement Toolkit. IEEE International Conference on Technologies for Homeland Security, 2010 . Jarke J. van Wijk and Edward .Cluster Calendar based Visualization of Time Series Data Colorbrewer: Color advice for maps. http://colorbrewer2.org/