Download
1 / 22
220 likes | 333 Views
Sensitivity of Squall-Line Rear Inflow to Ice Microphysics and Environmental Humidity. Ming-Jen Yang and Robert A. House Jr. Mon. Wea. Rev., 123, 3175-3193. Hsiao-Ling Huang 2004/01/09. Introduction.

E N D
Sensitivity of Squall-Line Rear Inflow to Ice Microphysics and Environmental Humidity Ming-Jen Yang and Robert A. House Jr.Mon. Wea. Rev., 123, 3175-3193 Hsiao-Ling Huang 2004/01/09
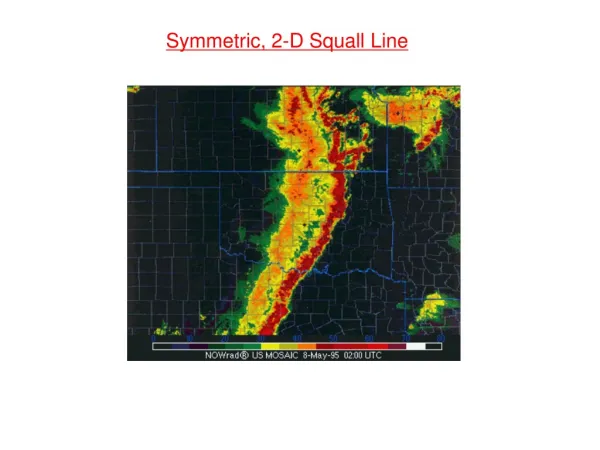
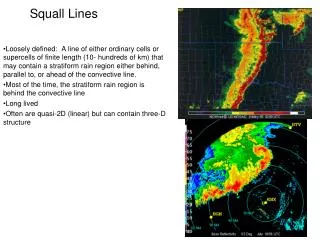
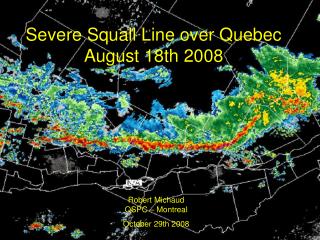
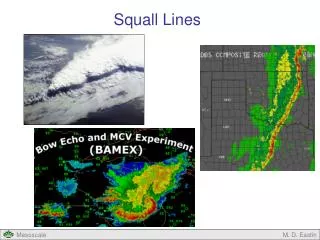
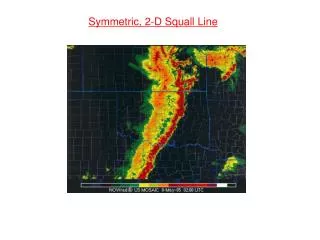
Introduction • Squall line with 50-200 km wide trailing stratiform precipitation regions are an important type of organized mesoscale convective system (MCS), which occur in both the Tropics and midlatitudes. • A mesoscale storm-relative ascending front-to-rear (FTR) flow, transporting hydrometeors rearward from a leading-edge convective line to the trailing stratiform region. • A mesoscale storm-relative rear-to-front (RTF) flow, descending through the stratiform region toward low levels in the leading convective region.
Zhang and Gao(1989) performed mesoscale model simulations of an intense midlatitude squall line indicating that the large-scale baroclinicity provided deep and favorable RTF flow within the upper half of the troposphere. • Fovell and Ogura (1989) and Weisman (1992) showed that the RTF flow increased in strength with increasing environmental vertical wind shear and convective available potential energy (CAPE). • This study use a high-resolution nonhydrostatic cloud model to perform six numerical experiments in order to determine the sensitivity of the storm structure to hydrometeor types, ice-phase microphysics, and environmental humidity.
Δ z = 550 m Fine mesh=1 kmStretch grid is 1.075:1 2250 km 314 km 2250 km Δ z = 140 m Model description • Numerical modelCompressible nonhydrostatic clod model.A 2D simulation (x-z). grid points: 455 (H) × 62 (V) domain: 4814 km(H)×21.7 km(V) • Cloud microphysicsFive types of water condensate are include: cloud water, cloud ice, rainwater, snow, and hail (Lin et al. 1983).
1985/06/10/2331 UTC [Enid(END), Oklahoma]. T, TD, u, v 1985/06/10/2330 UTC [Pratt(PTT), Kansas]. Low-level moisture • Initial conditions 1985/06/10~11 1985/06/10/2331 UTC
A 5-km deep, 170-km-long cold pool of ΔΘ´= -6 K and Δqv´ = -4 g kg-1
The control experiment (CNTL) • A control run (CNTL) with full model physics for 15 h. • The justification for turning off hail generation processes ( at t = 6 h) after the early stage is that there were very few hailstones in the mature or decaying stage of the 10-11 June squall line.
Overview of the storm development INI; t = 7.5-8.5 h MAT; t = 10-11 h Hail is turned off DEC; t = 12.5-13.5 h 45~53% 28~36%
Evolution of the squall-line structure Kinematic structure The rear inflow plays a crucial role in supplying potentially cold and dry midlevel air from the environment to aid in the production of the convective and mesoscale downdraft.
w c Evolution of the squall-line structure Thermal and pressure structure L H L L H L H
Air parcel trajectories Trajectories of precipitation particles t = 10-11 h t = 10-11 h
150 km 55 km Hailstorm simulation (HAIL)
150 km 60 km No ice-phase microphysics (NICE) 7K 4K 12.2 ms-1 8 ms-1
No evaporative cooling (NEVP) 12.2 ms-1 5 ms-1
S W No latent cooling by melting (NMLT) 12.2 ms-1 12 ms-1
No latent cooling by sublimation (NSUB) 12.2 ms-1 10.8 ms-1 The latent cooling by evaporation and melting are the most important microphysical processes determining the structure and strength of rear inflow in the cloud-model simulations.
W S Drier midlevel environment (DRYM) 12.2 ms-1 12.2 ms-1
Role of mesolows in the formation of the descending rear-to-front flow Mature (t = 10-11 h) Late (t = 12.5-13.5 h)
Conclusions • The mass convergence associated with the ascending FTR flow and descending RTF flow in the trailing stratiform region was crucial to the generation and maintenance of mesoscale updraft and downdraft. • The most important latent cooling is produced by evaporative cooling of rainwater. • The structure and strength of the rear inflow is sensitive to precipitating hydrometeor types, ice-phase microphysics, and the latent cooling of evaporation, melting, and sublimation.