Download
1 / 29
300 likes | 489 Views
Comparison of Commercial Crop Canopy Sensors. Ken Sudduth Newell Kitchen Scott Drummond USDA-ARS, Columbia, Missouri. Missouri VR-N research. Began on-farm research using canopy sensors in 2004

E N D
Comparison of Commercial Crop Canopy Sensors Ken Sudduth Newell Kitchen Scott Drummond USDA-ARS, Columbia, Missouri
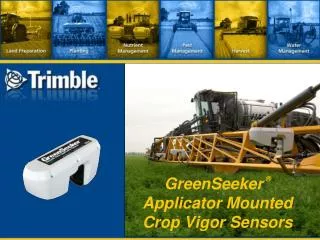
Missouri VR-N research • Began on-farm research using canopy sensors in 2004 • Field-length sensor-controlled strips and imbedded small plots to define N response variability across landscapes • Data were collected with GreenSeeker and Crop Circle ACS-210; N application based on CC data
ARS-Missourisystem • Implemented on a Spra-Coupe • Used a “binary nozzle” concept with 3 different valve manifolds
Spra-Coupe application system • Drop nozzles with 1x, 2x, and 4x orifice plates were installed in row middles to cover 6-row strip plots • Nominal application rates: • 1x = 30 lb N/acre 2x = 60 3x = 90 • 4x = 120 5x = 150 6x = 180 7x = 210
Are Crop Circle and GreenSeeker sensor readings different? • They’re not identical, but since they follow a straight line, we can use either one – if the rate equation is adjusted correctly
Comparison of application rates – Not much difference Crop Circle GreenSeeker
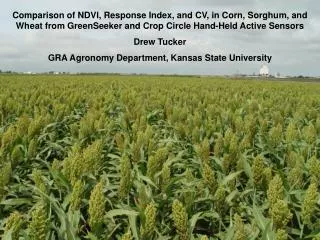
Missouri VR-N research • Most of our early data analysis and interpretation was with Crop Circle (ACS-210) data – how do GreenSeeker and Topcon CropSpec sensors compare? • A 2009 study comparing commercial sensors gave unexpected results • Study was redesigned and repeated in 2010 • Three commercial sensors were compared based on: • Relative NDVI • Temporal stability • Correlation to SPAD and crop height
Sensor geometry as used in previous field research: Crop Circle and GreenSeeker on rows 2 and 5 of 6-row pass; CropSpec from adjacent runs Data collected at 10 Hz from Crop Circle and GreenSeeker; 1 Hz from CropSpec
Data collection plots • Response blocks with 8 N rates • 0 to 235 kg/ha on 34 kg/ha increments applied soon after planting (0 to 210 lb/ac on 30 lb/ac increments) • Each plot 12 rows (9 m) wide by 15 m long • Two data passes with 6-row machine in each plot • 2.5 m of data trimmed from each end, leaving center 10 m • Reflectance data collected multiple times • Corn height ~ 1 to 1.5 m • Pass averages calculated and used for analysis
Auxiliary data collection • Corn height • Indicator of total biomass • SPAD chlorophyll meter reading • Indicator of leaf N concentration from Sudduth et al., 2010
Comparing Crop Circle and CropSpec relative NDVI Mean crop height = 1.4 m Mean crop height = 0.9 m
Different sensed areas Crop Circle and GreenSeeker at 10 Hz (~60 points/sensor/plot) CropSpec at 1 Hz (~6 points/sensor/plot)
Comparing relative NDVI • GreenSeeker and Crop Circle highly correlated • More differences between CropSpec and the two nadir sensors • Sensed area of the two sensors • Data not collected simultaneously (generally from adjacent run, < 5 min time difference) • Slope and offset considerations
Temporal stability of sensor data • Data from all three sensors exhibited stability over a period of >7 hours (r ≥ 0.92) • GreenSeeker slightly more variable over time • Possible reasons for temporal differences: • Driving misalignment between runs (nadir sensors) • Sensor variations (ambient light effects) • Ambient condition changes (leaf surface moisture, plant alignment due to wind, etc.) • Physiological changes in the plants • Effects were not large in this study
Relating sensor data to SPAD • CropSpec most strongly related to SPAD
Relating sensor data to crop height • GreenSeeker and Crop Circle more strongly related to corn height
Sensors vs. biophysical data • CropSpec more predictive of SPAD (N) • Oblique view minimized height/distance effect • Sensed lower leaves where N was more strongly expressed • Crop Circle and GreenSeeker more predictive of height (biomass) • Effects of distance and also mixed soil/plant scene
Summary In a comparison of three commercial crop canopy sensors: • Pass-average relative NDVIs from all three sensors were strongly correlated • Highest correlation between Crop Circle and GreenSeeker • Relative NDVI from all sensors was stable over time • Slightly more temporal variability with GreenSeeker • Relative NDVI from all sensors was related to both crop height (biomass) and SPAD (N concentration) • CropSpec data most strongly affected by SPAD • CC and GS more strongly affected by crop height/biomass
Summary • Can CropSpec data be used in existing algorithms developed for Crop Circle or GreenSeeker? • Appropriate slope and offset compensation would be required • Additional field research is needed to determine stability of slope and offset values over different crop conditions • Because effects of biophysical parameters are different for CropSpec than for Crop Circle and GreenSeeker better results may be obtained with sensor-specific algorithms
2011 Sensor comparison • Very narrow range in 2011 sensor data • Similar growth stage and crop height to 2010 data • 2012--- #1?#
Missouri algorithm developed from previous plot research • Notes: • Maximum N rate should not exceed 220 lbs N/acre. • For V6-V7 corn, the value of ratioreference should not exceed 0.37 for Crop Circle and 0.30 for GreeenSeeker. Set this as a ceiling. • For V8-V10 corn, the value of ratioreference should not exceed 0.25 for Crop Circle and 0.18 for GreeenSeeker. Set this as a ceiling.