Download
1 / 27
270 likes | 362 Views
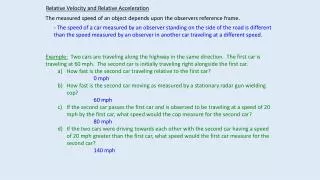
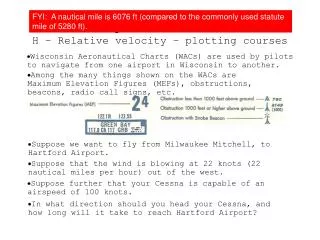
Relative Velocity. Ms. Rosebery is walking at 1 m/s [E]. Ms. Wood is walking at 1 m/s [W]. Mr. Fox is running at 4 m/s [W]. What is Ms. Rosebery’s velocity relative to Ms. Wood? A. 1 m/s [E] B. 2 m/s [E] C. zero What is Mr. Fox’s velocity relative to Ms. Wood?

E N D
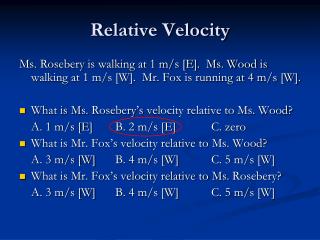
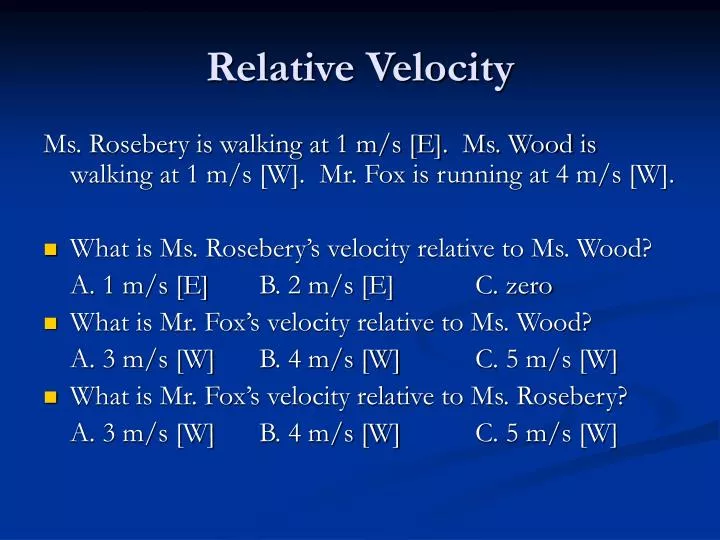
Relative Velocity Ms. Rosebery is walking at 1 m/s [E]. Ms. Wood is walking at 1 m/s [W]. Mr. Fox is running at 4 m/s [W]. • What is Ms. Rosebery’s velocity relative to Ms. Wood? A. 1 m/s [E] B. 2 m/s [E] C. zero • What is Mr. Fox’s velocity relative to Ms. Wood? A. 3 m/s [W] B. 4 m/s [W] C. 5 m/s [W] • What is Mr. Fox’s velocity relative to Ms. Rosebery? A. 3 m/s [W] B. 4 m/s [W] C. 5 m/s [W]
Relative Velocity Ms. Rosebery is walking at 1 m/s [E]. Ms. Wood is walking at 1 m/s [W]. Mr. Fox is running at 4 m/s [W]. • What is Ms. Rosebery’s velocity relative to Ms. Wood? A. 1 m/s [E] B. 2 m/s [E] C. zero • What is Mr. Fox’s velocity relative to Ms. Wood? A. 3 m/s [W] B. 4 m/s [W] C. 5 m/s [W] • What is Mr. Fox’s velocity relative to Ms. Rosebery? A. 3 m/s [W] B. 4 m/s [W] C. 5 m/s [W]
Graphing Displacement and Velocity: Learning Goal • The student will be able to create and analyse displacement-time graphs and velocity-time graphs of motion in one dimension (using slopes of displacement-time graphs to find velocities and using the area under velocity-time graphs to find displacement). (B2.2)
Practice Question 1 Redux Although Leah jogged at a constant speed for 1 minute, she spent the first 30 s of that minute jogging North and the second 30 s jogging South.
Practice Question 1 Redux Her velocity, which is a vector quantity defined as the rate of change in her displacement, was therefore 3 m/s [North] (or 3 m/s if we designate North the positive direction) for the first 30 s and 3 m/s [South] (or -3 m/s if we designate South the negative direction) for the second 30 s. + _
Practice Question 1 Redux Plot Leah's velocity on the grid below with time on the horizontal axis and velocity on the vertical axis. Label your axes! (Note that there is a discontinuity at 30 s.)
Practice Question 1 Redux Plot Leah's velocity on the grid below with time on the horizontal axis and velocity on the vertical axis. Label your axes! (Note that there is a discontinuity at 30 s.)
Practice Question 1 Redux Plot Leah's velocity on the grid below with time on the horizontal axis and velocity on the vertical axis. Label your axes! (Note that there is a discontinuity at 30 s.)
Area Under The area under a velocity-time graph will be equal to the displacement. Use the graph to calculate the displacement at 0 s, 10 s, 20 s, etc. Note that an area under the horizontal axis will be a negative area.
Area Under Example: At 40 seconds, the area under the graph is:
Displacement-Time Plot the data points in the table with time on the horizontal axis and displacement on the vertical axis. Label your axes!
Displacement-Time Plot the data points in the table with time on the horizontal axis and displacement on the vertical axis. Label your axes!
Displacement-Time Where is Leah relative to her starting position at the end of the 1 minute?
Displacement-Time Where is Leah relative to her starting position at the end of the 1 minute? At her starting point.
Average Velocity We can find the average velocity over any time interval by finding the slope of the line connecting the endpoints of the interval on the displacement-time graph. What was Leah’s average velocity over the 1 minute time interval?
Average Velocity We can find the average velocity over any time interval by finding the slope of the line connecting the endpoints of the interval on the displacement-time graph. What was Leah’s average velocity over the 1 minute time interval? 0 m/s because her displacement was zero.
More Practice Interpreting Graphs The graph at right shows the position-time or displacement-time graph of a radio controlled car. (Positive = [forward]) On a separate sheet of graph paper, • Describe each segment of the motion in words. • Sketch the corresponding distance-time graph. • Sketch the corresponding velocity-time graph.
More Practice Interpreting Graphs • Describe each segment of the motion in words. Between 0 and 2 s, the car is travelling at
More Practice Interpreting Graphs • Describe each segment of the motion in words. Between 0 and 2 s, the car is travelling at 4 m/s [fwd]. Between 2 s and 4 s,
More Practice Interpreting Graphs • Describe each segment of the motion in words. Between 0 and 2 s, the car is travelling at 4 m/s [fwd]. Between 2 s and 4 s, the car is at rest. Between 4 s and 9 s,
More Practice Interpreting Graphs • Describe each segment of the motion in words. Between 0 and 2 s, the car is travelling at 4 m/s [fwd]. Between 2 s and 4 s, the car is at rest. Between 4 s and 9 s, the car is travelling at 2 m/s [back]. Between 9 s and 10 s,
More Practice Interpreting Graphs • Describe each segment of the motion in words. Between 0 and 2 s, the car is travelling at 4 m/s [fwd]. Between 2 s and 4 s, the car is at rest. Between 4 s and 9 s, the car is travelling at 2 m/s [back]. Between 9 s and 10 s, the car is at rest.
More Practice Interpreting Graphs On a separate sheet of graph paper, • Sketch the corresponding distance-time graph.
More Practice Interpreting Graphs On a separate sheet of graph paper, • Sketch the corresponding distance-time graph.
More Practice Interpreting Graphs On a separate sheet of graph paper, • Sketch the corresponding velocity-time graph.
More Practice Interpreting Graphs On a separate sheet of graph paper, • Sketch the corresponding velocity-time graph.