Download
1 / 25
250 likes | 268 Views
This study presents detailed simulations and predictions for solar cycles 12 through 24 using a predictive flux-transport dynamo model. The model incorporates various factors such as differential rotation, magnetic fields, and meridional circulation to forecast the properties of upcoming solar cycles.

E N D
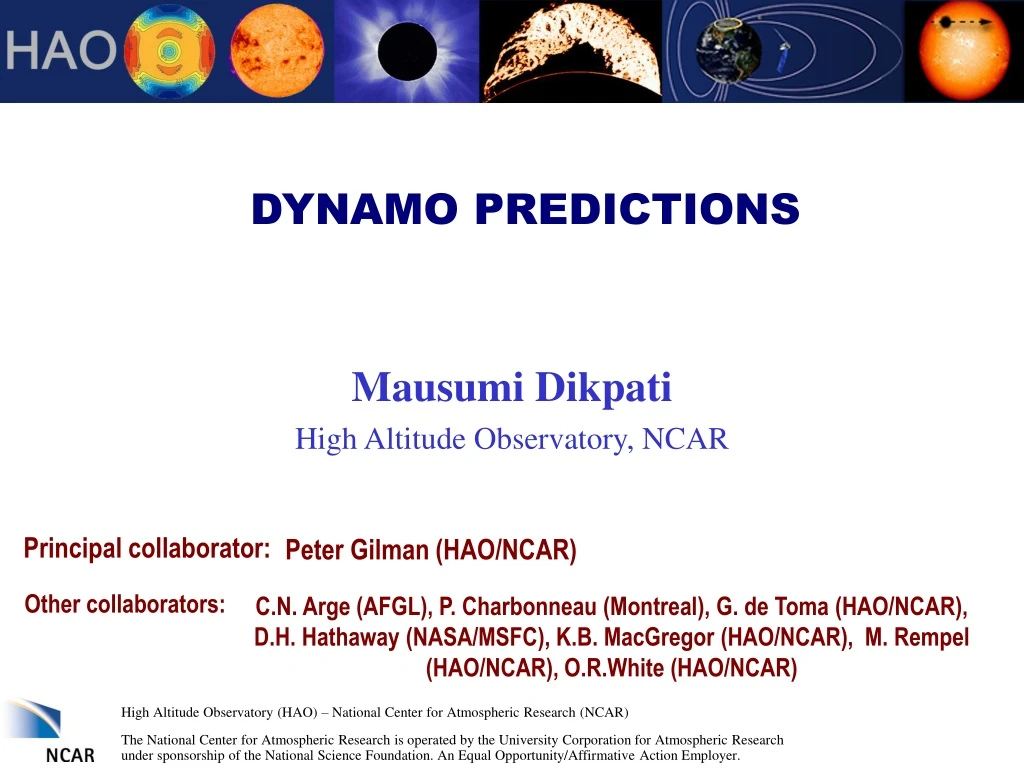
DYNAMO PREDICTIONS Mausumi Dikpati High Altitude Observatory, NCAR Principal collaborator: Peter Gilman (HAO/NCAR) Other collaborators: C.N. Arge (AFGL), P. Charbonneau (Montreal), G. de Toma (HAO/NCAR), D.H. Hathaway (NASA/MSFC), K.B. MacGregor (HAO/NCAR), M. Rempel (HAO/NCAR), O.R.White (HAO/NCAR)
Review: simulations of relative peaks of cycle 12 through 24 • We reproduce the sequence of peaks of cycles 16 through 23 • We predict cycle 24 will be 30-50% bigger than cycle 23 (Dikpati, de Toma & Gilman, 2006, GRL)
Review: Timing prediction for cycle 24 onset Dikpati, 2004, ESA-SP, 559, 233
Review: End of cycle 23 in butterfly diagram Cycle 23 onset Pred. cycle 24 onset
Review: End of cycle 23 in white light corona Mar. 29, 2006 Nov. 1994 Early 1996 Current coronal structure not yet close to minimum; more like 12-18 months before minimum Corona at last solar minimum looked like this
Schematic summary of predictive flux-transport dynamo model Shearing of poloidal fields by differential rotation to produce new toroidal fields, followed by eruption of sunspots. Spot-decay and spreading to produce new surface global poloidal fields. Transport of poloidal fields by meridional circulation (conveyor belt) toward the pole and down to the bottom, followed by regeneration of new toroidal fields of opposite sign.
Mathematical Formulation Toroidal field Poloidal field Meridional circulation Differential rotation Under MHD approximation (i.e. electromagnetic variations are nonrelativistic), Maxwell’s equations + generalized Ohm’s law lead to induction equation : (1) Applying mean-field theory to (1), we obtain the dynamo equation as, (2) Turbulent magnetic diffusivity Differential rotation and meridional circulation from helioseismic data Poloidal field source from active region decay Assume axisymmetry, decompose into toroidal and poloidal components:
Poloidal and toroidal field equations (3a) (3b) (i) Both poloidal and toroidal fields are zero at bottom boundary (ii) Toroidal field is zero at poles, whereas poloidal field is parallel to polar axis (iii) Toroidal field zero at surface; poloidal fields from interior match potential field above surface (iv) Both poloidal and toroidal fields are antisymmetric about the equator
An α-effect arising from decay of tilted bipolar active regions Babcock 1961, ApJ, 133, 572 A Babcock-Leighton type poloidal source-term can be represented as, Latitude dependence Confines in a thin layer near the surface Quenching Amplitude
Calibrated Model Solution Contours: toroidal fields at CZ base Gray-shades: surface radial fields Observed NSO map of longitude-averaged photospheric fields (Dikpati, de Toma, Gilman, Arge & White, 2004, ApJ, 601, 1136)
Construction of surface poloidal source In the Babcock-Leighton flux-transport dynamo In the dynamo-based predictive tool The equation (1b) remains unchanged. (1a) becomes: (3a) (3b)
Construction of surface poloidal source (contd.) Original data (from Hathaway) Period adjusted to average cycle Assumed pattern extending beyond present
Evolution of a predictive solution Toroidal field Latitudinal field Color shades denote latitudinal (left) and toroidal (right) field strengths; orange/red denotes positive fields, green/blue negative Latitudinal fields from past 3 cycles are lined-up in high-latitude part of conveyor belt These combine to form the poloidal seed for the new cycle toroidal field at the bottom (Dikpati & Gilman, 2006, ApJ, 649, 498)
Sensitivity tests of predictive model • Separating data into North and South hemispheres • Varying the averaging length in the observed surface poloidal source • Making more realistic latitudinal migration of the surface source, rather than steadily migrating Gaussian (see Cameron & Schuessler, 2006) • Varying the meridional flow with time and depth, and diffusivity with depth Constraints that should be applied • Retain constraints from observations and theory, on differential rotation, meridional circulation, surface diffusivity, depth of convection zone and tachocline • Recalibrate model to large-scale solar cycle features and correct period
Separating N & S hemispheres and varying averaging length Model reproduces relative sequence of peaks in N & S separately, but smoothes short-time scale solar cycle features
Correlation between area and flux (Dikpati, Gilman & de Toma, 2006, in preparation)
Correlation coefficients as function of averaging length in input data
Summary • High skill extends to input data separated into N & S hemispheres • Even short-period of averaging of input data leads to high skill in forecast when compared to the long-term averaged observations • Forecasting of difference between N & S hemisphere peaks has less but still significant skill • High surface diffusivity and long transport time to the bottom together smooth out the short-term observational features; therefore we will not be able to forecast short-term solar cycle features by this model
How helioseismology can help us to achieve our future goals • We will simulate and predict N & S hemispheric features by simultaneously incorporating N & S data, to examine effects of cross-equatorial transport and diffusion of flux • We have partial information about N/S asymmetry in meridional flow (from Irene and Rudi) since 2001. Could we get longer-term information as well as information about deeper layers ?
How helioseismology can help us to achieve our future goals (contd.) • Our active-longitude theory (Dikpati & Gilman, 2005, ApJ) predicts that tachocline bumps migrating in longitude govern the appearance and evolution of active longitudes. • Could helioseismology tell us about such asphericities from sound speed anomalies? Expected longitudinal wavenumbers m=1 and 2. • These bumps are predicted to have a specific phase relationship with global velocity patterns at the same depth • Could helioseismology find global m=1 and 2 velocity patterns in tachocline, using “deep-focus time-distance measurements”?
Answering mean-field dynamo skeptics • Our results speak for themselves; skeptics have used no model that contains either meridional circulation or Babcock-Leighton type surface poloidal source. Can’t use the output from (their) model “B” to disprove the skill of (our) model “A” • Predicting solar cycle peaks using mean-field dynamo is impossible • Too many assumed inputs • Most inputs constrained by observations; model calibrated to observations to set diffusivity • Meridional circulation is unimportant, so can be ignored • Meridional circulation is crucial for getting the correct phase between the poloidal and toroidal fields, and for transporting poloidal fields of previous cycles to high-latitudes at depth where ‘seed’ for new cycle is created
Answering mean-field dynamo skeptics (contd.) • Babcock-Leighton poloidal source “old-fashioned” • It is observed, so can’t be ignored • Solar dynamo is in deterministic chaos, and heavily nonlinear, therefore unpredictable • We have demonstrated predictive skill by reducing the dynamo to a linear system forced at the upper boundary by the observed poloidal fields of previous cycles. Atmospheric models achieve predictive skill beyond “chaotic” limits if they involve known boundary forcing (El Nino forecasts and annual cycles). Nonlinear feedbacks of induced magnetic fields on inducing solar motions (e.g. differential rotation) are small (torsional oscillations)