Download
1 / 17
170 likes | 329 Views
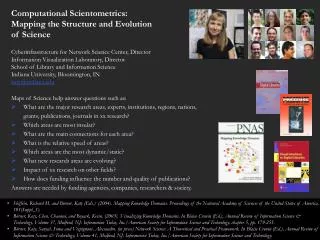
Computational Scientometrics: Mapping the Structure and Evolution of Science Cyberinfrastructure for Network Science Center, Director Information Visualization Laboratory, Director School of Library and Information Science Indiana University, Bloomington, IN katy@indiana.edu

E N D
Computational Scientometrics: • Mapping the Structure and Evolution • of Science • Cyberinfrastructure for Network Science Center, Director • Information Visualization Laboratory, Director • School of Library and Information Science • Indiana University, Bloomington, IN • katy@indiana.edu • Maps of Science help answer questions such as: • What are the major research areas, experts, institutions, regions, nations, • grants, publications, journals in xx research? • Which areas are most insular? • What are the main connections for each area? • What is the relative speed of areas? • Which areas are the most dynamic/static? • What new research areas are evolving? • Impact of xx research on other fields? • How does funding influence the number and quality of publications? • Answers are needed by funding agencies, companies, researchers & society. • Shiffrin, Richard M. and Börner, Katy (Eds.) (2004). Mapping Knowledge Domains. Proceedings of the National Academy of Sciences of the United States of America, 101(Suppl_1). • Börner, Katy, Chen, Chaomei, and Boyack, Kevin. (2003). Visualizing Knowledge Domains. In Blaise Cronin (Ed.), Annual Review of Information Science & Technology, Volume 37, Medford, NJ: Information Today, Inc./American Society for Information Science and Technology, chapter 5, pp. 179-255. • Börner, Katy, Sanyal, Soma and Vespignani, Alessandro. (in press) Network Science: A Theoretical and Practical Framework. In Blaise Cronin (Ed.), Annual Review of Information Science & Technology, Volume 41, Medford, NJ: Information Today, Inc./American Society for Information Science and Technology.
Dec 1 & 2, 2005: Mapping Science Workshop at Thomson Scientific, Philadelphia, PA.
April 4, 2006: Mapping Science Workshop at the New York Academy of Science, New York City, NY.
May 21, 2006: Modeling Science Workshop at Indiana University, Bloomington, IN.
May 29 & 30, 2006: Integrating Semantic and Linkage-Based Data Mining Approaches Albert Mons & Marc Weber, Knewco visit our Lab/Center.
August 30 & 31, 2006: Scholarly Data and Data Integration Workshop at Indiana University, Bloomington, IN.
Mapping the Evolution of Co-Authorship Networks in Information Visualization, 1988 - 2004Ke, Visvanath & Börner, (2004) Won 1st price at the IEEE InfoVis Contest. 7
Spatio-Temporal Information Production and Consumption of Major U.S. Research Institutions Börner & Penumarthy. (2005) Does Internet lead to more global citation patterns, i.e., more citation links between papers produced at geographically distant research instructions? Analysis of top 500 most highly cited U.S. institutions. Each institution is assumed to produce and consume information. g82-86 = 1.94 (R2=91.5%) g87-91 = 2.11 (R2=93.5%) g92-96 = 2.01 (R2=90.8%) g97-01 = 2.01 (R2=90.7%) 9
Mapping Medline Papers, Genes, and Proteins Related to Melanoma Research Boyack, Mane & Börner. (2004) IV Conference, pp. 965-971. 10
Mapping Indiana’s Intellectual Space • (Ke, Börner & Mei, 2005) • Identify • Pockets of innovation • Pathways from ideas to products • Interplay of industry and academia 11
Places & Spaces: Cartography of the Physical and the Abstract This science exhibit aims to demonstrate the power of maps to navigate physical places and abstract knowledge spaces. http://vw.indiana.edu/places&spaces/
The Power of MapsFour Early Maps of Our World VERSUS Six Early Maps of Science(1st Iteration of Places & Spaces Exhibit - 2005)
The Power of Reference SystemsFour Existing Reference Systems VERSUS Six Potential Reference Systems of Science(2nd Iteration of Places & Spaces Exhibit - 2006) For Sale!
The Power of ForecastsFour Existing Forecasts VERSUS Six Potential Science ‘Weather’ Forecasts(3rd Iteration of Places & Spaces Exhibit - 2007) ? ? ? ? ? ? ? ? ? ?
CAREER: Visualizing Knowledge Domains. NSF IIS-0238261 award (Katy Börner, $451,000) Sept. 03-Aug. 08. http://iv.slis.indiana.edu/ SEI: Network Workbench: A Large-Scale Network Analysis, Modeling and Visualization Toolkit for Biomedical, Social Science and Physics Research. NSF IIS-0513650 award (Katy Börner, Albert-Laszlo Barabasi, Santiago Schnell, Alessandro Vespignani & Stanley Wasserman, Eric Wernert (Senior Personnel), $1,120,926) Sept. 05 - Aug. 08. http://nwb.slis.indiana.edu 16