Download
1 / 27
270 likes | 671 Views
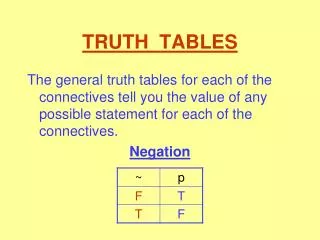
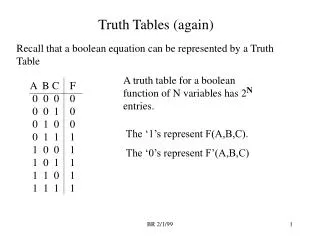
Truth Tables (again). Recall that a boolean equation can be represented by a Truth Table. A truth table for a boolean function of N variables has 2 N entries.

E N D
Truth Tables (again) Recall that a boolean equation can be represented by a Truth Table A truth table for a boolean function of N variables has 2N entries. A B C F 0 0 0 0 0 0 1 0 0 1 0 0 0 1 1 1 1 0 0 1 1 0 1 1 1 1 0 1 1 1 1 1 The ‘1’s represent F(A,B,C). The ‘0’s represent F’(A,B,C) BR 2/1/99
Truth Table to SOP Form Can write SOP form of equation directly from truth table. F(A,B,C) = A’BC + AB’C’ + AB’C + ABC’ + ABC A B C F 0 0 0 0 0 0 1 0 0 1 0 0 0 1 1 1 1 0 0 1 1 0 1 1 1 1 0 1 1 1 1 1 Note that each term in has ALL variables present. If a product term has ALL variables present, it is a MINTERM. A’BC AB’C’ AB’C ABC’ ABC BR 2/1/99
Truth Table to POS Form To get POS form of F, write SOP form of F’, then use DeMorgan’s Law. F’(A,B,C) = A’B’C’ + A’B’C + A’BC’ Take complement of both sides: (F’(A,B,C))’ = (A’B’C’ + A’B’C + A’BC’)’ Apply DeMorgan’s Law to right side. Left side is (F’)’ = F. F(A,B,C) = (A’B’C’)’ (A’B’C)’ (A’BC’)’apply DeMorgan’s Law to each term F(A,B,C) = (A+B+C) (A+B+C’)(A+B’+C) A B C F 0 0 0 0 0 0 1 0 0 1 0 0 0 1 1 1 1 0 0 1 1 0 1 1 1 1 0 1 1 1 1 1 A’B’C’ A’B’C A’BC’ POS Form!! BR 2/1/99
Minterms, Maxterms We saw that: F(A,B,C) = A’BC + AB’C’ + AB’C + ABC’ + ABC’ + ABC SOP form. If a product term has all variables present, it is a MINTERM. F(A,B,C) = (A+B+C) (A+B+C’)(A+B’+C) POS form. If a sum term has all variables present, it is a MAXTERM. All Boolean functions can be written in terms of either Minterms or Maxterms. BR 2/1/99
Minterm, Maxterm Notation Each line in a truth table represents both a Minterm and a Maxterm. Row No. A B C Minterms Maxterms 0 0 0 0 A’B’C’ = m0 A+B+C = M0 1 0 0 1 A’B’C = m1 A+B+C’ = M12 0 1 0 A’B C’ = m2 A+B’+C = M2 3 0 1 1 A’B C = m3 A+B’+C’ = M3 4 1 0 0 A B’C’ = m4 A’+B+C = M4 5 1 0 1 A B’C = m5 A’+B+C’= M5 6 1 1 0 A B C’ = m6 A’+B’+C = M6 7 1 1 1 A B C = m7 A’+B’+C’ = M7 BR 2/1/99
Using Minterms, Maxterms A boolean function can be written in terms of Minterm or Maxterm notation as a shorthand method of specifying the function. F(A,B,C) = A’BC + AB’C’ + AB’C + ABC’ + ABC’ + ABC = m3 + m4 + m5 + m6 + m7 = m(3,4,5,6,7) F(A,B,C) = (A+B+C) (A+B+C’)(A+B’+C) = M0 M1 M2 = M(0,1,2) Minterms correspond to ‘1’s of F, Maxterms correspond to ‘0’s of F in truth table. BR 2/1/99
From Minterms to Truth Table Minterms correspond to ‘1’s in Truth table F(A,B,C) = m(1,2,6) = m1 + m2 + m6 = A’B’C + A’BC’ + ABC’ A B C F 0 0 0 0 0 0 1 1 0 1 0 1 0 1 1 0 1 0 0 0 1 0 1 0 1 1 0 1 1 1 1 0 m1 m2 m6 BR 2/1/99
From Minterms to Maxterms to Truthtable To go from Minterms to Maxterms, list the numbers that are NOT present (with 3 variables, minterm/maxterm numbers range from 0 to 7 A B C F 0 0 0 0 0 0 1 1 0 1 0 1 0 1 1 0 1 0 0 0 1 0 1 0 1 1 0 1 1 1 1 0 M0 F(A,B,C) = m(1,2,6) = M(0,3,4,5,7) = (A+B+C)(A+B’+C’)(A’+B+C) (A’+B+C’)(A’+B’+C’) M3 M4 M5 M7 Maxterms correspond to ‘0’s in Truth table BR 2/1/99
Examples F(A,B,C,D) = m(0) (minterm form) = A’B’C’D’ (SOP form) = M(1,2,3,4,5,6,7,8,9,10,11,12,13,14,15) (maxterm form) (POS form too long to write…..) F(A,B) = m(1,2) (minterm form) = A’B + AB’ (SOP form) = M(0,3) (maxterm form) = (A+B)(A’+B’) (POS form) = A xor B (did you recognize this?) BR 2/1/99
Minterm Expansion A minterm must have every variable present. If a boolean product term does not have every variable present, then it can be expanded to its minterm representation. F(A,B,C) = AB + C neither AB, or C are minterms To expand AB to minterms, use the relation: AB = AB(C+ C’) = ABC + ABC’To expand C to minterms, do: C = C(A+A’) = AC+ A’C = AC(B+B’) + A’C(B+B’) = ABC + AB’C + A’BC + A’B’C F = AB +C = A’B’C + A’BC + AB’C + ABC’ + ABC F(A,B,C) = S m(1,3,5,6,7) BR 2/1/99
Maxterm Expansion A maxterm must have every variable present. If a boolean sum term does not have every variable present, then it can be expanded to its maxterm representation. F(A,B,C) = (A+B) (C) neither (A+B), or C are maxterms To expand (A+B) to maxterms, use the relation: (A+B) = (A+B+C’C) = (A+B+C’)(A+B+C)To expand C to minterms, do: C = C+A’A = (A’+C)(A+C) = (A’+BB’+C)(A+C+BB’) = (A’+B’+C)(A’+B+C)(A+B’+C)(A+B+C)F = (A+B)(C) = (A+B+C)(A+B+C’)(A+B’+C)(A’+B+C)(A’+B’+C)F(A,B,C) = P M(0,1,2,4,6) BR 2/1/99
Minimize from Minterm From Y = S m(3,4,5,6,7)Y = A’BC + AB’C’ + AB’C + ABC’ + ABC Look for differences in only one variable Y = A’BC + AB’(C’ + C) + AB(C’ + C) = A’BC + AB’ + AB = A’BC + A(B’ +B) = A’BC + A = BC + A A difference in only one variable is called a Boolean Adjacency. BR 2/1/99
Minimize from POS Y = P M(0,1,2)Y = (A+B+C)(A+B+C’)(A+B’+C) Again, look for differences in only one variable Y = (A+B + CC’) (A+B+C) = (A+B)(A+B’+C) = (A+B)((A+C) + B’) = (A+B)(A+C) + (A+B)B’ = A + BC + AB + BB’ = A + AB + BC = A(1 + B) + BC = A + BC BR 2/1/99
Karnaugh Maps • Karnaugh Maps (K-Maps) are a graphical method of visualizing the 0’s and 1’s of a boolean function • K-Maps are very useful for performing Boolean minimization. • Will work on 2, 3, and 4 variable K-Maps in this class. • Karnaugh maps can be easier to use than boolean equation minimization once you get used to it. BR 2/1/99
K-Maps A K-map has a square for each ‘1’ or ‘0’ of a boolean function. One variable K-map has 21 = 2 squares.Two variable K-map has 22 =4 squaresThree variable K-map has 23 = 8 squaresFour variable K-map has 24 = 16 squares 3 variable 1 variable 2 variable 4 variable BR 2/1/99
Plotting Functions on K-Maps Each square represents a row in the truth table. The values in each square is the value of F from the truth table. A=0 A=1 Row A F(A) 0 0 ? 1 1 ? A=0 A=1 r0 r1 ? ? Row A F(A) 0 0 0 1 1 1 A=0 A=1 F(A) = A 0 1 Row A F(A) 0 0 1 1 1 0 A=0 A=1 F(A) = A’ 1 0 BR 2/1/99
Plotting 2-Variable Functions Row A B F(A,B) 0 0 0 ? 1 0 1 ? 2 1 0 ? 3 1 1 ? A A 0 1 0 1 B B 0 ? ? 0 r0 r2 1 ? ? 1 r1 r3 Row 0 from TT, A=0, B= 0 Row A B F(A,B) 0 0 0 0 1 0 1 1 2 1 0 1 3 1 1 1 A 0 1 B 0 0 1 F(A,B) = A + B 1 1 1 BR 2/1/99
Plotting 2-Variable Functions (cont.) Row A B F(A,B) 0 0 0 0 1 0 1 1 2 1 0 1 3 1 1 0 A 0 1 B 0 0 1 F(A,B) = A’B + AB’ 1 1 0 Row A B F(A,B) 0 0 0 0 1 0 1 0 2 1 0 0 3 1 1 1 A 0 1 B 0 0 0 F(A,B) = AB 1 0 1 BR 2/1/99
Plotting 3-Variable Functions A Row A B C F(A,B,C) 0 0 0 0 ? 1 0 0 1 ? 2 0 1 0 ? 3 0 1 1 ? 4 1 0 0 ? 5 1 0 1 ? 6 1 1 0 ? 7 1 1 1 ? 0 1 BC 00 ? ? 01 ? ? 11 ? ? 10 ? ? A 0 1 BC 00 r0 r4 01 r1 r5 11 r3 r7 10 r2 r6 BR 2/1/99
Boolean Adjacency Note on the three variable map: A A 0 1 0 1 BC BC 00 r0 r4 00 r0 r4 01 01 r1 r5 r1 r5 11 10 r3 r7 r2 r6 10 r2 r6 11 r3 r7 WRONG!!! Correct Each square on the 3-variable map is Boolean Adjacent. Adjacent squares only differ by ONE BOOLEAN VARIABLE!!! BR 2/1/99
Boolean Adjacency A 0 1 BC 00 f(A’B’C’) f(AB’C’) 01 f(A’B’C) f(AB’C) 11 f(A’BC) f(ABC) 10 f(A’BC’) f(ABC’) Squares at bottom of map adjacent to squares top of map. Each square is boolean adjacent to neighbor. BR 2/1/99
Plotting 3-Variable Functions A Row A B C F(A,B,C) 0 0 0 0 1 1 0 0 1 0 2 0 1 0 1 3 0 1 1 0 4 1 0 0 0 5 1 0 1 0 6 1 1 0 1 7 1 1 1 0 0 1 BC 00 1 0 01 0 0 11 0 0 10 1 1 F(A,B,C) = m(0,2,6) BR 2/1/99
Another 3-variable Example A Row A B C F(A,B,C) 0 0 0 0 0 1 0 0 1 0 2 0 1 0 0 3 0 1 1 0 4 1 0 0 1 5 1 0 1 1 6 1 1 0 1 7 1 1 1 0 0 1 BC 00 0 1 01 0 1 11 0 0 10 0 1 F(A,B,C) = m(4,5,6) BR 2/1/99
Plotting 4-Variable Functions Row A B C D F(A,B,C,D) 0 0 0 0 0 ? 1 0 0 0 1 ? 2 0 0 1 0 ? 3 0 0 1 1 ? 4 0 1 0 0 ? 5 0 1 0 1 ? 6 0 1 1 0 ? 7 0 1 1 1 ? 8 1 0 0 0 ? 9 1 0 0 1 ?10 1 0 1 0 ?11 1 0 1 1 ?12 1 1 0 0 ?13 1 1 0 1 ?14 1 1 1 0 ?15 1 1 1 1 ? AB 00 01 11 10 CD 00 ? ? ? ? 01 ? ? ? ? 11 ? ? ? ? 10 ? ? ? ? AB 00 01 11 10 CD 00 r0 r4 r12 r8 01 r1 r5 r13 r9 11 r3 r7 r15 r11 10 r2 r6 r14 r10 BR 2/1/99
Boolean Adjacency AB 01 11 10 00 CD 00 f(A’B’C’D’) f(A’BC’D’) f(ABC’D’) f(AB’C’D’) 01 f(A’B’C’D) f(A’BC’D) f(ABC’D) f(AB’C’D) 11 f(A’B’CD) f(A’BCD) f(ABCD) f(AB’CD) 10 f(A’B’CD’) f(A’BCD’) f(ABCD’) f(AB’CD’) Squares at bottom of map adjacent to squares top of map and vice-versa.Squares at left edge are adjacent to squares at right edge and vice-versa. BR 2/1/99
Plotting 4-Variable Functions Row A B C D F(A,B,C,D) 0 0 0 0 0 0 1 0 0 0 1 0 2 0 0 1 0 1 3 0 0 1 1 1 4 0 1 0 0 0 5 0 1 0 1 0 6 0 1 1 0 1 7 0 1 1 1 0 8 1 0 0 0 0 9 1 0 0 1 010 1 0 1 0 111 1 0 1 1 012 1 1 0 0 013 1 1 0 1 014 1 1 1 0 015 1 1 1 1 1 AB 00 01 11 10 CD 00 0 0 0 0 01 0 0 0 0 11 1 0 1 0 10 1 1 0 1 F = m(2,3,6,10,15) BR 2/1/99
What do you need to Know? • Minterm, Maxterm definitions • Truth table to Minterms, vice versa • Truth table to Maxterms, vice versa • Minterms to Maxterms, vice versa • Plotting 2,3,4 variable functions on K-Maps BR 2/1/99