Download

1 / 18
180 likes | 280 Views
This study presents a heuristic procedure and HLRA model for optimizing airline hub locations as M/D/C queues, with computational experience, examples, solutions, and comparisons. Assumptions and results of the model implementation are discussed, showcasing improved congestion management and cost-benefit analyses. The comparison with previous models highlights the benefits of evenly distributing passenger flow to reduce overcrowding and delays at hub airports. Conclusions emphasize the effectiveness of the new models in mitigating congestion and optimizing hub operations.

E N D
Location Models For Airline Hubs Behaving as M/D/C Queues By: Shuxing Cheng Yi-Chieh Han Emile White
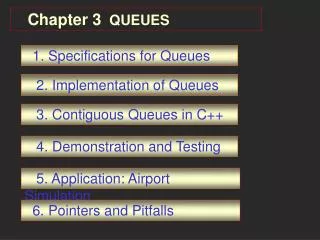
Outline • Heuristic Procedure • HLRA Model • Computational Experience • Examples • CAB data • Solutions and Comparisons • Conclusions
HLRA1 Model k i j m
Heuristic Procedure • To solve the model, the procedure has two phases : • Construction phase: • Find the initial set of p (A fixed number of servers) locations by using greedy heuristic model • Randomly chose one of the three best nodes but not the best and add it to the set of locations • Improvement phase: • Use one-opt exchange heuristic and diversification step to find optimum set of locations • Move location of each hub in initial solution to non-hub and compare value before and after trade • Determine new set of locations with tabu search procedure until no improvement is obtained, i.e. no less than minimum solution
Computational Experience ( 900 instances ) No. of each hub k i j Assumptions: 1) Traffic between nodes ~uniform[0,5] 2) Hub-to-hub transportation costs save 50% 3) Fixed costs of each hub are set to 10000, 25000 and 50000 4) Right-hand side of the capacity constraint is set to 1200, 1400 and 1600 Result: Fixed Cost of each hub , average cost , number of hubs , 25 s
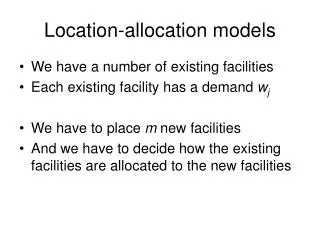
Model • Our model was evaluated on a set of 25 U.S. cities. • Different features of the model were changed to analyze the results: • Savings percentage: α = 0.25, 0.5, 0.75 • Different fixed operating costs: 40,000 vs. 60,000 • Different levels of total flow were analyzed
Results • As the savings percentage increased, so did the cost of the operation. • The number and location of hubs varies more for lower levels of α and for lower initial fixed costs. • However, the number and location of hubs tends to stabilize as the level of α increases.
Results • We can then choose a specific situation and analyze the statistics of each individual hub airport. • We can then view each different airport hub in the system and determine which airports are near capacity and which ones are relatively underused. • Can view amount of traffic that goes through one hub versus multiple hubs.
Different Models • This model differs when compared with previous models without capacity constraints. • Previous work on uncapacitated multiple hub models would focus more traffic through certain hubs. • This may have reduced costs overall, but it can lead to overutilization in some hubs and underutilization of other hubs. • In reality, this would cause overcrowding and delays that the hub. • The new model sets capacity limits that distributes passengers more evenly to different airports. • This means less congestion in certain airports. • To compare the two models, fixed costs were set to zero and a new constraint was added that fixes the number of hubs in the model.
Comparison • This table shows the comparison of our two models. • We can see for the model from this paper (HLRA), the passenger flow is more evenly spread among the different hubs. • The costs are a little higher, but this model potentially alleviates congestion and overcrowding at certain hub airports that could lead to delays that are not accounted for in the models.
Figure 2-5 show multiple assignment network with 20-node problem for various values of and 3 hubs using both models. As the value of increases, the number of multiple assignments in both UMAHMP and HLRAI models increases.
Conclusions • Compared to the existing models, the congestion at each hub is considered in the new model. • The key feature of this new model is the transformation of the probabilistic constraint stating that the amount of congestion in a hub cannot exceed a given threshold with a given probability, into a deterministic linear constraint. • Hubs are modeled as M/D/c queuing system. • A novel procedure is developed to solve this system.