Download
1 / 62
620 likes | 884 Views
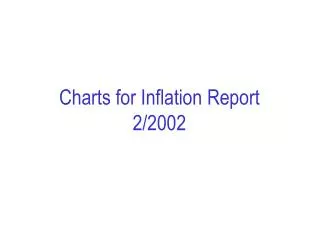
Charts for Inflation Report 2/2002. Chart 1.1 Consumer prices adjusted for tax changes and excluding energy products (CPI-ATE). Total 1) and distributed by imported consumer goods and domestically produced goods and services 2) . 12-month rise. Per cent. Goods and services produced in Norway.

E N D
Chart 1.1 Consumer prices adjusted for tax changes and excluding energy products (CPI-ATE).Total1) and distributed by imported consumer goods and domestically produced goods and services2).12-month rise.Per cent Goods and services produced in Norway CPI-ATE Imported consumer goods 1) Norges Bank's estimates up to July 2000, thereafter figures published by Statistics Norway 2) Norges Bank's estimates Sources: Statistics Norway and Norges Bank
Chart 1.2 Consumer prices (CPI).Total and adjusted for tax changes and excluding energy products. 12-month rise. Per cent CPI CPI-AT1) CPI-ATE1) CPI-AT:CPI adjusted for tax changesCPI-ATE:CPI adjusted for tax changes and excluding energy products 1) Norges Bank's estimates up to July 2000, thereafter figures published by Statistics Norway Sources: Statistics Norway and Norges Bank
Chart 1.3 Consumer prices.Energy products1).12-month rise.Per cent Electricity Fuel and lubricants 1) Electricity accounts for 3.3% of the total CPI.Fuel and lubricants account for 4.2% of the total CPI Sources: Statistics Norway and Norges Bank
Chart 1.4 Consumer prices adjusted for tax changes.Cars, clothing and footwear and imported consumer goods. 12-month rise. Per cent Imported consumer goods Cars Clothing and footwear Sources: Statistics Norway and Norges Bank
Chart 1.5 Consumer prices adjusted for tax changes and excluding energy products (CPI-ATE) by supplier sector. 12-month rise. Per cent Transport services Services with wages as a dominant price factor House rent CPI-ATE Sources: Statistics Norway and Norges Bank
Chart 1.6 Effective NOK exchange rates.Import-weighted exchange rate1) and trade-weighted exchange rate index.A falling curve denotes an appreciation of the krone Trade-weighted exchange rate index, TWI (1990=100) Import-weighted exchange rate, I-44 (1995=100) 1) The import-weighted exchange rate index was revised on 27 May 2002.See www.norges-bank.no ”News archive" for further information. Source:Norges Bank
Chart 1.7 Expectations concerning short-term money market rates.1) Quarterly figures. Per cent Forward rates 27 June Forward rates 25 October Forward rates 21 February 1 Three-month money market rates up to end-Q2 (27 June).Three-month forward rates are estimated using four money market rates and five government bond yields with different maturities as observed on 27 June. Source:Norges Bank
Chart 1.8 Forward rate differential against Germany.Percentage points 27 June 21 February 25 October Source:Norges Bank
Chart 1.9 Goods consumption index. 1995 = 100. Seasonally adjusted volume. 2002 2001 2000 Source:Statistics Norway
Chart 1.10 Credit from domestic sources (C2).Total and by borrowing sector. 12-month rise. Per cent Credit to non-financial enterprises C2 adjusted1) C2 Credit to households 1) Adjusted for central government transfer of capital to local government in January to repay debt in connection with the state takeover of hospitals. Source:Norges Bank
Chart 1.11 Unemployed (LFS), registered unemployed and persons participating in labour market programmes.Percentage of labour force.Seasonally adjusted1) Registered unemployed and labour market programmes LFS unemployment Registered unemployed 1) LFS unemployment:3-month moving average Sources: Statistics Norway and the Directorate of Labour
Chart 1.12 Change in unemployment on same month previous year.In thousands of persons Eastern Norway Whole country Western Norway Southern Norway Central and northern Norway Source:Directorate of Labour
Chart 1.13 GDP growth in the US, the euro area and Japan.Percentage change from previous quarter (annualised) Sources: National sources of statistics and EcoWin
Chart 1.14 Equity prices and long-term interest rates in the US, and prices for industrials (USD).Index, Week 1 in 2001 = 100. Long rates Wilshire 5000 Industrials Sources: Norges Bank, EcoWin, The Economist and Wilshire Associates
Pvt consumption Net exports Private investment Inventories Gen.govt consumpt and investm. GDP Chart 2.1 Quarterly change in US GDP, annualised.Contribution to growth in volume. Per centSeasonally adjusted Sources: Bureau of Economic Analysis and Norges Bank
Chart 2.2 US:Household debt-servicing capacity.Interest and principal as a percentage of disposable income Consumer loans Housing loans Source:The Federal Reserve
Pvt consumption Net exports Investments Stocks Public consumption GDP Chart 2.3 Quarterly change in euro area GDP, annualised.Contribution to growth in volume. Per cent.Seasonally adjusted Sources: Bureau of Economic Analysis and Norges Bank
Chart 2.4 Japan: industrial output and exportsPercentage growth compared with same month previous year Exports Industrial output Sources:Japanese Ministry of Finance and Ministry of International Trade and Industry
Chart 2.5 Growth in hourly wages in industry in the US and the euro area.Growth on same quarter previous year.Per cent US Euro area Source:OECD
Chart 2.6 The oil price, Brent Blend.USD per barrelDaily figures Futures prices 26 June 2002 IR 2/2002 Sources: International Petroleum Exchange, Telerate and Norges Bank
Chart 2.7 Metal prices (level) and industrial output in G7 countries1).12-month rise.Per cent G7 industrial output (left-hand scale) Metal prices, index (right-hand scale) 1) US, Japan, Germany, France, UK, Canada and Italy Sources: OECD and The Economist
Chart 3.1 Mainland GDP, person-hours and employment.Percentage change from previous year Mainland GDP Employment Person-hours Source:Statistics Norway
Chart 3.2 Change in structural non-oil budget balance1) 1) Budget balance as a percentage of trend mainland GDP; change on previous year. Source:Revised National Budget, Ministry of Finance
Chart 3.3 Real underlying spending growth in the government budget and growth in mainland GDP.Percentage change from previous year Mainland GDP Underlying spending growth Sources: Statistics Norway, the Ministry of Finance and Norges Bank
Chart 3.4 Household saving as a percentage of disposable income. Previous national accounts figures Revised national accounts figures Source:Statistics Norway
Chart 3.5 Household debt as a percentage of disposable income and household interest expenses after tax as a percentage of cash income Interest burden (right-hand scale) Debt (left-hand scale) Source: Norges Bank
Chart 3.6 Relative labour costs in Norwegian manufacturing compared with trading partners.Index: 1970=100 Local currency Common currency Sources: Statistics Norway, TBU and Norges Bank
Chart 3.7 Manufacturing employment, 1970-2001.In 1000s of people employed. Source:Statistics Norway
Chart 3.8 Percentage change in employment from previous year and unemployment1) as a percentage of the labour force Employed (right-hand scale) Unemployment rate (left-hand scale) 1) Total of registered unemployed and persons participating in labour market programmes Sources: Statistics Norway, the Directorate of Labour and Norges Bank
Chart 3.9 Percentage change in labour force from previous year, and labour force as a percentage of population aged 16-74 (labour force participation rate). Labour force participation (left-hand scale) Change in LFS labour force (right-hand scale) Sources: Statistics Norway and Norges Bank
Chart 4.1 Annual wage growth1) and unemployment rate2).Per cent Annual wage growth Unemployment rate 1) Average for all groups.Including costs of additional vacation days in 2000 and 2001 2) Registered unemployed and persons on labour market programmes as a percentage of the labour force Sources:TBU, Directorate of Labour and Norges Bank
Chart 4.2 Profitability in manufacturing.Wage share1) and return on total assets2). Return on total assets (left-hand scale) Wage share (right-hand scale) 1) Labour costs as a percentage of value added 2) Result for the year + net interest and financial costs as a share of total assets.Excluding oil companies Sources:Statistics Norway and Norges Bank
Chart 4.3 Producer and consumer prices for Norway's trading partners. 12-month rise. Per cent Consumer prices Producer prices Sources:EcoWin, Datastream, the OECD and Norges Bank
Chart 4.4 Import-weighted exchange rate and prices for imported consumer goods adjusted for tax changes. 12-month rise. Per cent Imported consumer goods Import-weighted exchange rate (1995=100) Sources:Statistics Norway and Norges Bank
Chart 4.5 Consumer prices adjusted for tax changes and excluding energy products (CPI-ATE).Total and distributed by imported consumer goods and domestically produced goods and services. 12-month rise. Per cent Goods and services produced in Norway CPI-ATE Imported consumer goods Sources:Statistics Norway and Norges Bank
Chart 4.6 Consumer prices (CPI).Total and adjusted for tax changes and excluding energy products (CPI-ATE).12-month rise.Per cent CPI CPI-ATE Sources: Statistics Norway and Norges Bank
30% 50% 70% 90% Chart 4.7 Consumer price inflation1).Projections and uncertainty. 12-month rise. Per cent 2.5 2.5 1) Adjusted for tax changes and excl. energy products (CPI-ATE). The bands in the fan indicate different probabilities for consumer price inflation. Sources: Statistics Norway and Norges Bank
Chart 4.8 Various scenarios for the trade-weighted exchange rate index (TWI) Trade-weighted exchange rate index (1990=100) Uncovered interest rate parity Average June (95.1) Average last 3 mths (97.1) Source:Norges Bank
Chart 4.9 Projected rise intheCPI-ATE assuming that the interest rate follows market expectations, and different assumptions regarding the krone exchange rate. 12-month rise. Per cent Uncovered interest rate parity CPI-ATE Average June Sources:Statistics Norway and Norges Bank
Overnight rate IR 2/02: 6.5 Deposit rate 3-month money market rate Source:Norges Bank
Trade-weighted exchange rate index, TWI (1990=100) IR 2/02: 97.1 Import-weighted exchange rate, I-44 (1995=100) IR 2/02: 92.5 Source:Norges Bank
The credit indicator (C2), credit to households and total credit to the non-financial private sector and municipalities, mainland Norway (C3).12-month growth.Per cent C3 mainland Norway C2 Credit to households Source:Norges Bank
Consumer prices (CPI and CPI-ATE).12-month rise.Per cent CPI CPI-ATE Source:Norges Bank
3-month rates in the US, the euro area and Japan.Per cent US Euro area1) Japan 1)Theoretical ECU rate up to December 1998 Sources:EcoWin and Norges Bank
Mainland GDP and private consumption.Percentage change from previous year Private consumption Mainland GDP Source:Statistics Norway
RAMMEFIGURER: Why has the krone appreciated?(ArK og TBe)
Chart 1 Effective NOK exchange rate.Trade-weighted exchange rate index (TWI)1) TWI (1990=100) 1) A rising curve denotes an appreciation of the krone Source:Norges Bank
Chart 2 Trade-weighted exchange rate index1) and interest rate differentials against other countries2) 3-month interest rate differential3-month (left-hand scale) 12-month interest rate differential (left-hand scale) TWI (right-hand scale) 1) A rising curve denotes an appreciation of the krone 2) US, euro area, the UK and Sweden Source:Norges Bank