Download
1 / 60
620 likes | 930 Views
Radio Ratings 101. Broadcast Programming – Towson University February 21, 2008 David Johnston, Senior Policy Analyst. Source: Robert J. Coen, Universal McCann. Source: TNS Media Intelligence. The Macro View. What are “ratings”? What’s the value in the industry?

E N D
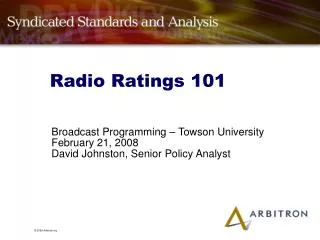
Radio Ratings 101 Broadcast Programming – Towson University February 21, 2008 David Johnston, Senior Policy Analyst
The Macro View • What are “ratings”? • What’s the value in the industry? • Credibility/Validity issues.
The Ratings • Quantitative measure of audience (or exposure) to media. • Survey based • Basic principles apply no matter what media you are assessing: • How many total people in the audience? • How much did the average person listen/watch/read/view (i.e. “consume”)? • Estimates are cited in context of survey, geography, demo and daypart • e.g. Fall 2007 Baltimore Metro P12+ Mon-Sun 6am-Midnight
Some Terms of the Trade • Cume • AQH (Average Quarter Hour) • Persons • Rating • Share • TSL (Time Spent Listening) • Source: Guide to Understanding and Using Radio Audience Estimates (Purple Book) http://www.arbitron.com/downloads/purplebook.pdf
CUME PERSONS = Total # of DIFFERENT LISTENERS during the daypart Requirement: 5 minutes
AQH (Average Quarter Hour)PERSONS = AVERAGE #of listeners during a 15 min period. 15 min 15 min
How Many AQH Persons? 34 + 1 + 3 + 4 = 12 divided by the number of QH (4)
Ratings … What is the “Value Proposition”? • Advertising rates • Programming analysis • Broadcast property pricing
Advertising Rates • Advertisers are willing to pay a certain amount to get their message to potential customers… • CPP (Cost per point) = the “market” rate to get your message in front of 1% of the market. • CPM (Cost per thousand) = the “market rate to get your message in front of 1000 people. • Source: Turning the numbers into Sales Solutions http://www.arbitron.com/downloads/2001numbersintosolutionsbrochure.pdf • Buyers (advertisers) and Sellers (broadcasters) need a standard to set and negotiate these rates that is: • Credible and stable • Widely accepted • Statistically valid
Programming • The program director’s job is to: • Get people to tune to the radio station. (Cume) • Get them to listen longer, and return to the station. • Occasions and Duration – (TSL) • Ratings help: • Market analysis (my listeners vs competitors listeners). • Trends (Is my base growing? Are people listening longer than they did before?)
Broadcast Property Valuation Audience → Revenue → Cash Flow → Radio Station Price Other considerations: • Size of market • Class of station • Coverage area
Larger Market = Larger Radio Revenue 1 25 50 Market Rank
Methodology Matters • History – Advertising revenue for a media grows when the measurement grows in sophistication and credibility. • Wall Street Journal article – 4/17/07 Counting Clicks • Accreditation – Media Rating Council (www.mediaratingcouncil.org)
What Does MRC Accreditation Mean? • Adheres the Council’s minimum standards • Supplies full information regarding details of operations • Conducts service in accordance with representatives to its subscribers and the Council • Submits to, and assumes costs for, thorough annual audits of accredited services by CPA firms engaged by the MRC
Methodology Matters • Consistent survey procedures • Random Sampling • Process control (interviewer training, data edit rules, sample weighting)
Syndicated Service Four 12 Week Survey Periods: • Winter, Spring, Summer Fall • PPM Holiday survey 302 Syndicated Markets: • 96 Markets are Continuous Measurement (4 surveys/yr) • Remainder are Spring/Fall Approximately 1.4 Million Diaries each year! Media Rating Council (MRC) Accredited
The Survey Process Market Specification Build Sample Pool Customer Servicing Select Sample Conduct Survey Diary Processing Report Processing Delivery
Market Specification • Which markets? • What geography? • Determine Metro Survey Area and Total Survey Area. • Define sampling units (counties or county equivalents). • Counties may be sub-divided if there is a reasonable expectation of systematic sampling performance differences for segments, and these correlate to radio audience listening pattern differences…whether due to geography or race/ethnicity.
Survey Bulletins:Communication of Market Changes as well as Methods Changes… http://www.arbitron.com/radio_stations/survey_wi07.html
Market Specification • What Sample Size. • Metro Intab target is calculated using a root function formula with population as the base. • Allocation to sampling units proportional with P12+ total population.
What does “Proportionate to Population” mean? The sample should look like the population on key characteristics.
8.7% 8.7% 8.7% 8.7% 29.6% 29.6% 25.1% 25.1% 9.6% 9.6% 15.9% 15.9% 1.6% 1.6% 3.5% 3.5% Allocation of Intab Target is geographically proportionate to population : • Sample target for each county or split-county based on population Population: Target:
Sampling and Survey Process Objective: Random in-tab sample for market proportional to population on key characteristics. • Age/sex - 16 discrete age/sex groups • Geography - Sampling Units (County or County equivalent) • Race/ethnicity - Black, Hispanic or Other • Month - One third of total intab sample per month Tools: Historical Performance, Predictive Models, CATI, Survey Material Packaging. Major Steps: Build Sample Pool, Select Phone Numbers, Conduct Survey
Build Sample Pool Sample Frame = All known listed and likely unlisted residential telephone numbers. • “Likely Unlisted Number” is any phone number in a hundred block (ie 489-53XX) with at least 2 listed residential numbers. Sort - Phone numbers into ascending order by zip code within sampling unit.
Calculate Starting Sample • Calculate amount of phone numbers (Starting Sample) needed for each sampling unit: • Intab Target: 1000 Intab Diaries • Factored by: 80% Sample Usability Rate 70% Consent Rate 2.0 Persons per Household 50% Return Rate • Starting Sample: 1786 Telephone numbers needed
Calculate Starting Sample: or in reverse: • Intab Target 1,000 • Return Rate = 50% 2,000 (need to mail) • Persons 12+ pHH = 2.0 1,000 Households (HH) • Consent Rate = 70% 1,429 calls to get 1,000 Hhs • Usability Rate = 80% 1,786 phone numbers
Select Phone Numbers Determine Sampling Interval: • Starting Sample: 382 Telephone numbers needed • Sample Pool: 100,000 Telephone numbers • Selection Interval = 100,000/382 = every 261st # Systematic Interval, Random Selection Technique Sample selection process provides geographically balanced in-tab sample
Select Phone Numbers Systematic Interval, Random Selection Technique Random Start Point
Conduct Survey Seven Day Listening diary with socio-economic questions (shopping/purchase questions for 162 markets). Telephone placement with ongoing contact via mail and telephone to encourage participation. Monetary premiums with diary, and some letters.
The Survey Process - Multiple Contacts: $ = Cash Premium included - amount varies
Conduct Survey Demographic groups with historically lower levels of survey participation receive Differential Survey Treatment: • Additional telephone calls • Larger cash premiums Differential Survey Treatment used for Households identified at placement as: • Black…in NY and Philly, the typical Black household gets four times as much cash as the typical “other” household • Hispanic • having a male 18-24 or 25-34 resident…the highest premiums go to Black households with males age 18-34
Differential Survey Treatments produce a more demographically balanced sample: Return rate data in chart is assumed for illustrative purposes.
An Interesting Correlate: Cell Phone Only Penetration and M18-24 Diary Sample Proportionality Cell Phone Only data from National Health Interview Survey
Diary Processing Objective: Accurate and consistent crediting of listening to radio stations based on known marketplace conditions. Tools: Station information, database tools, ICR/OCR technology, QA audits. Major Steps: • Diary Receipt, Preparation and Scanning • Usability Checks • Data Entry • QA and Customer Servicing
Listeners report: Resource: http://www.arbitron.com/downloads/Diarykeeper_brochure.pdf
Diarykeepers record the name of the station as they know it…
Report Processing Objective: Accurate reporting of listening projections. Tools: Historical trend analyses, report verification procedures. Major Steps: • Non-audience data preparation (Station/Mkt Info) • Project diary sample to population (Sample Balancing) • Tally/Calculate audience data • Pre-publication analysis
Weighting “101” Weightingfactors calculated for “classes”… Geography Sex/Age …based on proportion of: pop vs. in-tab County A: 21% ÷ 20% = 1.05 W35-44: 9% ÷ 10% = 0.90
Ethnicity is another variable in the weighting grid. Ethnic diaries are not always “weighted up” All Black diaries in market weighted by one of these factors