Download
1 / 21
230 likes | 403 Views
Scientific Inquiry and the Scientific Method. Understanding the World Around Us. Vocabulary Introduction. Observations/Facts you make with your senses that you know to be true . Quantitative : numbers Qualitative : descriptions that cannot be put in numbers. Vocabulary Introduction.

E N D
Scientific Inquiry and the Scientific Method Understanding the World Around Us
Vocabulary Introduction • Observations/Facts you make with your senses that you know to be true. • Quantitative: numbers • Qualitative: descriptions that cannot be put in numbers
Vocabulary Introduction • A time-tested concept that makes predictions about the natural world. Once proposed, it must be tested over again. It may be thrown out or modified.
Vocabulary Introduction • If a theory survives many tests it becomes a law. It summarizes observed experimental facts.
Vocabulary Introduction • An explanation or interpretation of observations. • Inferences are based on reasoning, not random guessing
Vocabulary Introduction • A forecast of what will happen in the future • Based on past evidence or observations.
Vocabulary Introduction • Observations/Facts you make with your senses that you know to be true. • Quantitative: numbers • Qualitative: descriptions that cannot be put in numbers • A time-tested concept that makes predictions about the natural world. Once proposed, it must be tested over again. It may be thrown out or modified. • If a theory survives many tests it becomes a law. It summarizes observed experimental facts.
Vocabulary Introduction • An explanation or interpretation of observations. • Inferences are based on reasoning, not random guessing • A forecast of what will happen in the future • Based on past evidence or observations.
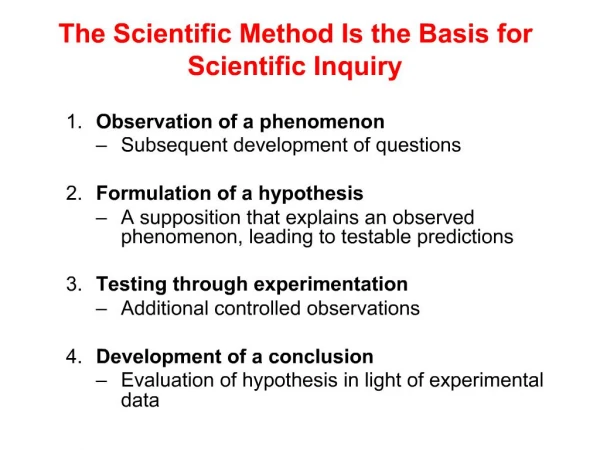
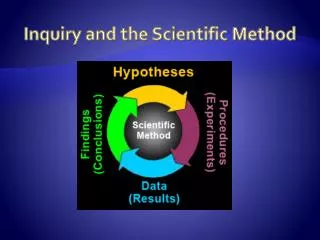
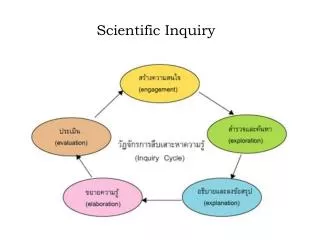
Steps of Scientific Inquiry • Uses senses to make observations. • Makes inferences or predictions based on observations. • Research the topic • Form a hypothesis • Design a controlled experiment to test the hypothesis • Perform the experiment and record data • Draw a conclusion Hypothesis is Accepted Hypothesis is Rejected Becomes a Theory Go back and redesign your hypothesis Accepted many times and proven mathematically Becomes a Law
Variable The one part of an experiment that is manipulated by the scientist Present in the experimental group, not present in the control group. Example: If you were testing the strength of different paper towels (like you did last year) the type of paper towel will be the variable.
A Controlled Experiment Has… Control Group • Setup according to “normal” conditions Experimental Group • Same as the Control Group, but with the variable Important Points: • They are exactly the same except for the experimental group having the variable(the one difference) • The larger the sample size, the more accurate the results
What is the variable (the one difference between the groups)?
Hypothesis Formation If • The conditions you are setting up (control group vs. experimental group) Then • Your predicted results. • (what you think will happen) Because • Your explanation for your predicted results. (why)
Independent Variable • The manipulated/experimental variable • This variable is the one you manipulate • What you the scientist can change • The responding variable • This is what you measure in the experiment • This variable’s value depends on the independent variable. It shows the results of your manipulation Dependent Variable
Experiment… • Does adding coffee grinds to plants help them grow faster? • Do people prefer Jerry’s Pizza or Lucio’s Pizza? • Dep:_____________ • Ind:_____________ • Dep:_____________ • Ind:_____________
Data TablesTo Properly Create a Data Table • Title • The title must describe what is being done. It must be in the following form. The Relationship Between the Independent Variable and the Dependent Variable • Columns & Rows: • Determine the number of rows and columns • First row is for headings • 1st Column Independent Variable • 2nd Column Dependent Variable
Data Tables cont..To Properly Create a Data Table • Labels • Label each column (what does the data represent) • Units • Put units for the numbers • Example: ml, cm, etc… • Sort Data • Place in an order, either least to greatest or greatest to least.
Constructing a Graph The Relationship Between the Independent and the Dependent Variable Title Axis Labels and Units The independent variable goes on the x-axis (horizontal) and the dependent goes on the y-axis (vertical Dependent Variable Independent Variable
Constructing a Graph cont.. Line Graph vs. Bar Graph • Bar Graphs are used to graph information that is not continuous. • Example: Mrs. Fugarino believes that student’s behavior in class is directly related to the teacher’s hair color. She conducted a study and discovered the following results which are graphed below.