Download
1 / 9
90 likes | 123 Views
Understand Liebig's Law, Gause's Principle, population growth factors, species distribution, trophic levels, and more in ecology. Learn about limiting factors, interspecific interactions, energy flow, and nutrient cycles in an ecosystem.

E N D
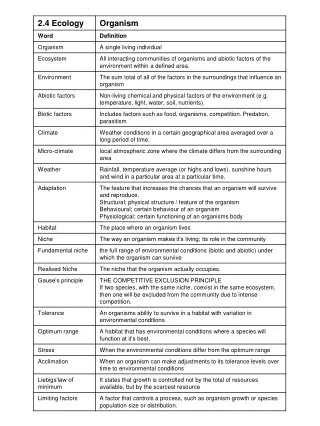
It states that growth is controlled not by the total of resources available, but by the scarcest resource Liebigs’law of minimum A factor that controls a process, such as organism growth or species population size or distribution. Limiting Factor In the Ecosystem Affect each other Organism SJ Gaze acclimatation Optimum range Organism To live in A habitat that has environmental conditions where a species will function at its best. allow tolerance All together makes up one species Gause’s Principle If two species, with the same niche, coexist in the same ecosystem, then one will be excluded from the community due to intense competition.
Weather extremes, climate K= carrying capacity Density independent Population regulation Density dependent If none then population reaches biotic potential • Food, Water, Shelter, Disease Organism Number of individuals in a defined area Population growth Density A single living individual Population number = 5 high low population Distribution All the organisms of a given species occupying a defined area Random Age Structure Mortality Natality Clumped Death rate per 1000 Birth rate per 1000 Uniform Survivorship curves Rapid growth slow growth zero growth Type l - low mortality in the juvenile phase K-Selected population growth Type ll – constant mortality rate through all ages Number of survivors (log scale) Type lll – high juvenile mortality Percentage of maximum life span Late reproduction, Long life span, Low mortality rate, Extensive parental care, Greater investment in maintenance and survival of adults, At or near carrying capacity Early reproduction, Short life span, High mortality rate, Little or no parental care, Large investment in producing large numbers of offspring, Below carrying capacity R-Selected population growth SJ Gaze Population
Changes in species distribution in time Community Territory Defending of space by a species Stratification Succession time Home range Area an individual or group may occupy a vertical gradient of abiotic factors location Zonation A graduated range of Abiotic factors (in an area Patterns Community A area that contains populations of species interacting with each other Same species Environmental heterogeneity Intraspecific interactions a range of resources in the natural habitat Interspecific interactions Different species Beneficial relationships Resource sharing – food, shelter Offspring / juvenile rearing Predation protection – warning, safety in numbers Exploitation Parasitism organism doesn't kill it’s host Herbivory Harmful relationships Competition for resources – food, space, light, nutrients, water, mates Consuming plants for food Predation Social organisation killing of other organisms for food SJ Gaze Predator-prey cycles
ONE WAY travel of energy through an ecosystem Consumer An organism that feeds off another organism, either plant or animal or fungi – often killing them in the process Energy lost through respiration and heat Consumer, producer or decomposer Position of an organism in a food chain Producer Species occupying trophic level one, the plants and phytoplankton that convert suns energy into food by the process of photosynthesis producer consumer decomposer Energy lost through consumption Light energy Decomposer An organism that feeds of dead organic material returning nutrients into the ecosystem photosynthesis Energy lost through death A series of organisms through which energy flows, the first link is always a producer. Trophic Levels Food chain Entering the ecosystem from the sun, about 1% gets converted to chemical energy but photosynthesis Ecosystem Ecosystem Circular travel of nutrients through an ecosystem Energy Pyramids Nutrient cycles respiration N2 Pyramid of energy These show the proportion of energy stored at each trophic level 10% passed on to each level respiration CO2 Carnivores combustion Pyramid of numbers respiration consumption Showing the number of organisms at each level required to feed one top carnivore. Herbivores Fossil fuels photosynthesis fossilisation Carbon Producers Pyramid of biomass death The total dry weight of organisms (standing crop) in a particular trophic level assimilation ammonification C NO3- N2 CO2 Nitrogen fixing bacteria ammonium NH4+ Decomposers Nitrates NO3- nitrification decomposition SJ Gaze