Download
1 / 22
220 likes | 244 Views
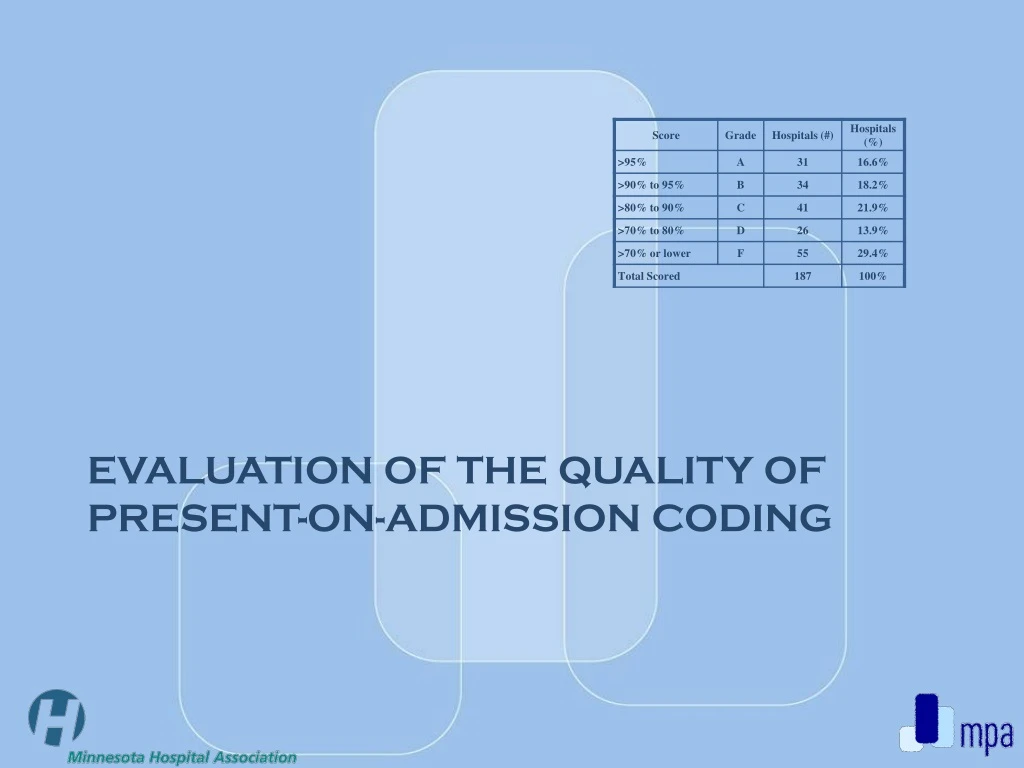
This study evaluates the quality of Present-on-admission (POA) coding and screening results for hospital scores across different medical conditions. It examines the distribution of total scores, risk-adjusted clinical performance, mortality rates, adverse outcomes, hospital costs, and readmission rates for conditions such as Congestive Heart Failure. The analysis includes insights on clinical effectiveness, practice performance across risk groups, and comparative cost-effectiveness assessments.

E N D
POA Screening Results for Sample Hospital Scores for High-Risk Medical Conditions * 1 = Best Result
POA Screening Results for Sample Hospital Scores for Elective Surgical Procedures * 1 = Best Result
POA Screening Results for Sample Hospital Scores for Labor and Delivery * 1 = Best Result
POA Screening Results for Sample HospitalScores for General Screens and Aggregate Performance * 1 = Best Result
Observed and Predicted Hospital Mortality RatesCongestive Heart Failure
Observed and Predicted Hospital Adverse Outcome RatesCongestive Heart Failure
Adverse Outcomes and Hospital CostsCongestive Heart Failure 7.99% $5,596 13.82% $6,629
Observed and Predicted 30-Day Readmission RateCongestive Heart Failure
Distribution of Adverse OutcomesCongestive Heart Failure Chi-square = 1.85 N.S.
Asymmetrical Relationships of Observed and Predicted Outcomes Provide Insights about Clinical Effectiveness Effect of Risk on Performance Overall Results Less Success with Low Risk Balanced Less Success with High Risk Superior Superior Practice with Low Risk Cases Superior Practice Across All Risk Groups Superior Practice with High Risk Cases Average Potential Problems with High Risk Cases No Particular Strengths or Weaknesses Potential Problems with Low Risk Cases Suboptimal Special Problems with High Risk Cases Suboptimal Practice Across All Risk Groups Special Problems with Low Risk Cases
Comparative Effectiveness Outcome (Best Providers) Outcome (Worst Providers) assessment of comparative cost-effectiveness Risk Stratification Comparison Input (B† only in high risk) Input (Not A or C) Cost-Effective Conclusion (Best Practice = A with B† only in high risk) Ineffective
Traditional Comparative Effectiveness AnalysesCongestive Heart Failure (First Line Therapy) Comparative Effectiveness Input A (+ Diuretics) Input A† (++ Diuretics) Comparative Effectiveness Input B† (+ Vasodilators) Input B (No Vasodilators) Comparative Effectiveness Input C (No Pressors) Input C† (+ Pressors) Conclusion (Best Practice = A+B† +C) Superior Inferior
Patient-Centered Comparative Cost-Effectiveness AnalysisCongestive Heart Failure (First Line Therapy) Comparative Effectiveness Outcome (Best Providers) Outcome (Worst Providers) Risk Stratification Comparison Input (B† only in high risk) Input (Not A† or C†) Conclusion (Best Practice = A with B† only in high risk) Cost-Effective Ineffective