Download
1 / 26
260 likes | 274 Views
Explore the concepts of homeostasis, evolution, and central metabolism in Dynamic Energy Budget (DEB) systems. Learn about the role of symbiogenesis in eukaryotic evolution and the maintenance of reserves and structures. Use the DEBtool to model the fluxes and growth rates of multiple reserve systems.

E N D
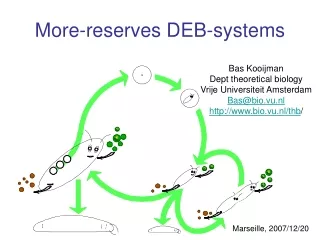
More-reserves DEB-systems Bas Kooijman Dept theoretical biology Vrije Universiteit Amsterdam Bas@bio.vu.nl http://www.bio.vu.nl/thb/ Marseille, 2007/12/20
More-reserves DEB-systems • Contents: • Homeostasis • Evolution of DEB systems • Central metabolism • Symbiogenesis • Dynamic nutrient limitation Bas Kooijman Dept theoretical biology Vrije Universiteit Amsterdam Bas@bio.vu.nl http://www.bio.vu.nl/thb/ Marseille, 2007/12/20
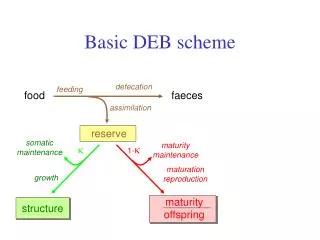
Homeostasis strong homeostasis constant composition of pools (reserves/structures) generalized compounds, stoichiometric contraints on synthesis weak homeostasis constant composition of biomass during growth in constant environments determines reserve dynamics (in combination with strong homeostasis) structural homeostasis constant relative proportions during growth in constant environments isomorphy .work load allocation ectothermy homeothermy endothermy supply demand systems development of sensors, behavioural adaptations
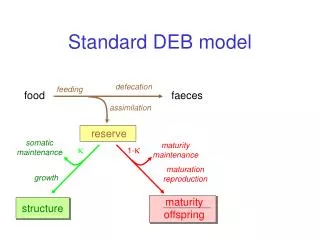
3 4 5 1 2 prokaryotes 7 plants 9 animals 6 8 Evolution of DEB systems variable structure composition strong homeostasis for structure increase of maintenance costs delay of use of internal substrates inernalization of maintenance installation of maturation program strong homeostasis for reserve Kooijman & Troost 2007 Biol Rev, 82, 1-30 reproduction juvenile embryo + adult specialization of structure
Central Metabolism 2.5 source polymers monomers waste/source
Modules of central metabolism 2.5 • Pentose Phosphate (PP) cycle • glucose-6-P ribulose-6-P, • NADP NADPH • Glycolysis • glucose-6-P pyruvate • ADP + P ATP • TriCarboxcyl Acid (TCA) cycle • pyruvate CO2 • NADP NADPH • Respiratory chain • NADPH + O2 NADP + H2O • ADP + P ATP
Evolution of central metabolism 2.5 in prokaryotes (= bacteria) 3.8 Ga 2.7 Ga i = inverse ACS = acetyl-CoA Synthase pathway PP = Pentose Phosphate cycle TCA = TriCarboxylic Acid cycle RC = Respiratory Chain Gly = Glycolysis Kooijman & Troost 2007 Biol Rev, 82, 1-30
Prokaryotic metabolic evolution 2.5 • Heterotrophy: • pentose phosph cycle • glycolysis • respiration chain • Phototrophy: • el. transport chain • PS I & PS II • Calvin cycle • Chemolithotrophy • acetyl-CoA pathway • inverse TCA cycle • inverse glycolysis
Symbiogenesis 2.5 2.7 Ga 2.1 Ga 1.27 Ga phagocytosis
Symbiosis9.1.3 substrate product
Symbiosis9.1.3 substrate substrate
Steps in symbiogenesis 9.1.3 Internalization Free-living, clustering Free-living, homogeneous Reserves merge Structures merge
Chemostat Steady States 9.1.3 Free living Products complementary Endosymbiosis Exchange on conc-basis Free living Products substitutable biomass density Exchange on flux-basis Structures merged Reserves merged Host uses 2 substrates throughput rate symbiont host
Symbiogenesis 9.1.3 • symbioses: fundamental organization of life based on syntrophy • ranges from weak to strong interactions; basis of biodiversity • symbiogenesis: evolution of eukaryotes (mitochondria, plastids) • DEB model is closed under symbiogenesis: • it is possible to model symbiogenesis of two initially independently • living populations that follow the DEB rules by incremental changes • of parameter values such that a single population emerges that • again follows the DEB rules • essential property for models that apply to all organisms • Kooijman, Auger, Poggiale, Kooi 2003 • Quantitative steps in symbiogenesis and the evolution of homeostasis • Biological Reviews78: 435 - 463
Maintenance from reserve & structure Tolla et al 2007 J. Theor Biol, 244, 576-587
DEBtool/alga/sgr sgr1, sgr2, sgr3, sgr4 The functions obtain the specific growth rate, the reserve and structure fluxes for maintenance and the rejected reserve fluxes for 1, 2, 3 and 4 reserve systems. All reserves are supplementary for maintenance as well as for growth, while each reserve and structure are substitutable for maintenance. The preference for the use of structure relative to that of reserve for maintenance can be set with a (non-negative) preference parameter. The value zero gives absolute priority to reserve, which gives a switch at specific growth rate 0. All functions sgr have the same structure, and the input/output is presented for sgri where i takes values 1, 2, 3 of 4. Inputs: (i,1)-matrix with reserve density mE (i,1)-matrix with reserve turnover rate kE (i,1)-matrix with specific maintenance costs from reserve jEM (i,1)-matrix with costs for structure yEV optional (i,1)-matrix with specific maintenance costs from structure jVM; default is jEM/ yEV optional scalar or (i,1)-matrix with preference parameter alpha; default is 0 Outputs: scalar with specific growth rate r (i,1)-matrix with reserve flux for maintenance jEM (i,1)-matrix with structure flux for maintenance jVMM (i,1)-matrix with rejected reserve flux jER scalar with info on failure (0) or success (1) of numerical procedure An example of use is given in mydata_sgr
Organic carbon pump 9.4 strong weak moderate Wind: producers bind CO2 from atmosphere and transport organic carbon to deep ocean light + CO2 “warm” no nutrients cold nutrients no light readily degradable recovery of nutrients to photo-zone controls pump poorly degradable bloom no growth growth poor growth
Reserve Capacity & Growth 5.2 low turnover rate: large reserve capacity high turnover rate: small reserve capacity
Simultaneous nutrient limitation 5.2.3 Specific growth rate of Pavlova lutheri as function of intracellular phosphorus and vitamine B12 at 20 ºC Data from Droop 1974 Note the absence of high contents for both compounds due to damming up of reserves, and low contents in structure (at zero growth)
Reserve interactions 5.2.4 Data from Droop 1974 on Pavlova lutheri B12-cont., 10-21.mol.cell-1 P-content, fmol.cell-1 P-conc, μM B12-conc, pM Spec growth rate, d-1 Spec growth rate, d-1 Spec growth rate, d-1
C,N,P-limitation5.2.4 N,P reductions P reductions N reductions Nannochloropsis gaditana (Eugstimatophyta) in sea water Data from Carmen Garrido Perez Reductions by factor 1/3 starting from 24.7 mM NO3, 1.99 mM PO4
C,N,P-limitation5.2.4 Nannochloropsis gaditana in sea water DIC For nitrate uptake rate phosphate spec growth rate res. dens. structure spec growth
C,N,P-limitation5.2.4 Nannochloropsis gaditana in sea water half-saturation parameters KC = 1.810 mM for uptake of CO2 KN = 3.186 mM for uptake of NO3 KP = 0.905 mM for uptake of PO4 max. specific uptake rate parameters jCm = 0.046 mM/OD.h, spec uptake of CO2 jNm = 0.080 mM/OD.h, spec uptake of NO3 jPm = 0.025 mM/OD.h, spec uptake of PO4 reserve turnover rate kE = 0.034 h-1 yield coefficients yCV = 0.218 mM/OD, from C-res. to structure yNV = 2.261 mM/OD, from N-res. to structure yPV = 0.159 mM/OD, from P-res. to structure carbon species exchange rate (fixed) kBC = 0.729 h-1 from HCO3- to CO2 kCB = 79.5 h-1 from CO2 to HCO3- initial conditions (fixed) HCO3- (0) = 1.89534 mM, initial HCO3- concentration CO2(0) = 0.02038 mM, initial CO2 concentration mC(0) = jCm/ kE mM/OD, initial C-reserve density mN(0) = jNm/ kE mM/OD, initial N-reserve density mP(0) = jPm/ kE mM/OD, initial P-reserve density OD(0) = 0.210 initial biomass (free)
Fast/slow substrate uptake • DEB-consistent variant of Morel 1987 • uptake depends on substrate concentration and reserve density • reserve mobilization independent of uptake Not yet tested against experimental data
DEB tele course 2009 Cambridge Univ Press 2000 http://www.bio.vu.nl/thb/deb/ Free of financial costs; some 250 h effort investment Program for 2009: Feb/Mar general theory April symposium in Brest (2-3 d) Sept/Oct case studies & applications Target audience: PhD students We encourage participation in groups who organize local meetings weekly Software package DEBtool for Octave/ Matlab freely downloadable Slides of this presentation are downloadable from http://www.bio.vu.nl/thb/users/bas/lectures/ Audience: thank you for your attention Organizers: thank you for the invitation