Download
1 / 32
320 likes | 369 Views
This presentation outlines a 10-point program to establish a European statistical-spatial framework, emphasizing the importance of providing quality information for government decision-making across all levels of authority. It discusses strategies for addressing sustainable development challenges and the complexities of the world as a system of systems. The focus is on creating actionable insights through effective data structuring and reducing complexity to meet user needs. The ultimate goal is to support sustainable development through concrete projects and the establishment of a network of excellence in spatial statistics.

E N D
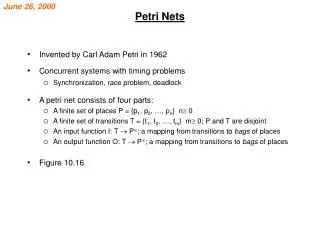
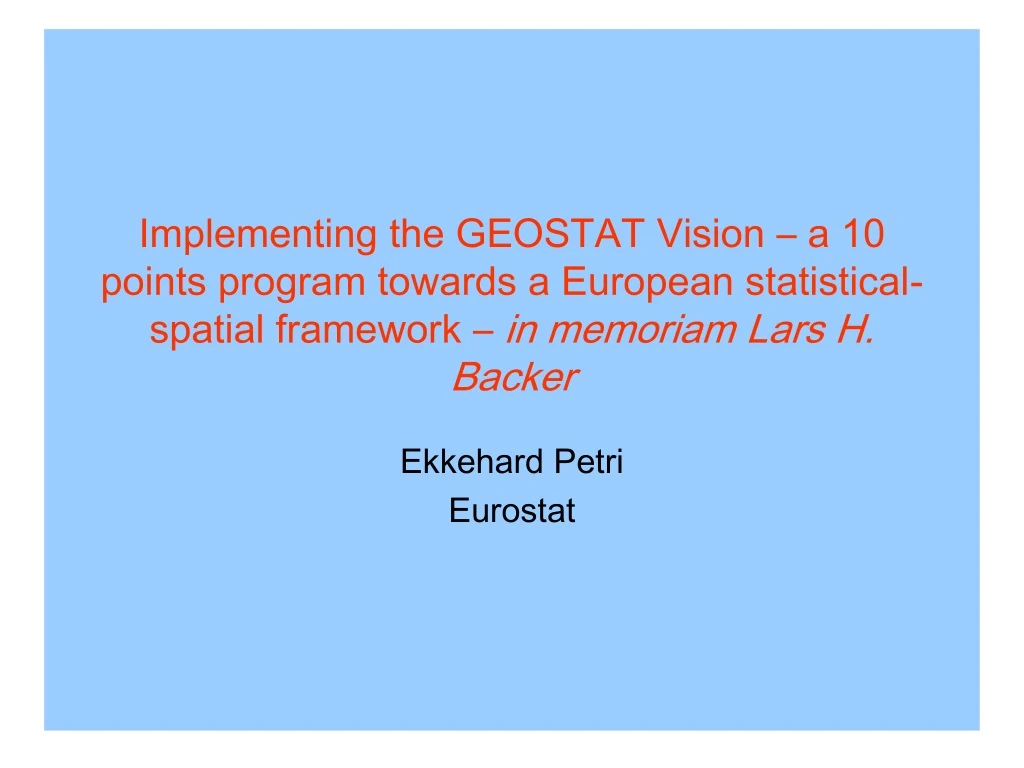
Implementing the GEOSTAT Vision – a 10 points program towards a European statistical-spatial framework – in memoriam Lars H. Backer Ekkehard Petri Eurostat
Thesis We as civil servants, members of the academia, or citizens of democratic nations are united here for one overriding purpose: To produce systems of qualified information to serve as foundation for direct and indirect government action on all levels of public authority from local to global. This is the sustainable development challenge!
Spaceship Earth EFGS conference 2015 Vienna
Solvable Problems? EFGS conference 2015 Vienna
Government user needs Ex-post Strategies(Conservative “Business as usual” attitude)Statistics for accounting and benchmarking Ex-ante StrategiesFor critical problems the demands response(Progressive “Lets face it” attitude”)Statistics for spatial and temporal analysis Preactive Interactive Reactive Inactive EFGS conference 2015 Vienna Russell Ackoff’s Strategies of management:
Government user needs • To control man environmental systems • Exploit opportunities • Counter threats • Through direct actions (concrete projects) • Examples • Build (or supervise) large-scale physical infrastructures • Protect natural resources for sustainable use • Through in-direct actions (legislation) EFGS conference 2015 Vienna
Systems Theory(The world as a system of systems in space and time) The world is complex beyond human understanding. Systems theory is a strategy to reduce this complexity down to a scale and complexity that can be described understood by human beings. Task: To describe the world as a system of systems using qualified temporal-spatial information. EFGS conference 2015 Vienna
Knowledge an integrated system (based on (scientific) expost perspective) , but not very practical (useful for the development of man environmental systems)! To become useful this information has to be re- structured andreduced to the mere necessities!
The Object approach Double perspective : (1) ”Interactingwholes” and (2) ”Kit of Parts” EFGS conference 2015 Vienna
Time Space/Scale Statistics EFGS conference 2015 Vienna
The Man-Environmental System described according to the ecological method Focus: • BE: Man-made environment • Layer ((maps &statistics) theme 1) • Layer ((maps &statistics) theme 2 • Layer ((maps &statistics) theme ...n) Context: • NE: Natural environment • Layer ((maps &statistics) theme 1) • Layer ((maps &statistics) theme 2 • Layer ((maps &statistics) theme ...n) • ES: Economic system • Layer ((maps &statistics) theme 1) • Layer ((maps &statistics) theme 2) • Layer ((maps &statistics) theme ...n) • SS: Sociocultural system • Layer ((maps &statistics) theme 1) • Layer ((maps &statistics) theme 2) • Layer ((maps &statistics) theme ...n) EFGS conference 2015 Vienna
Reduce complexity – scale Six levels of public authority from local to global: • 10000 km window/100km grids (Global scale) • 1000 km window/10km grids (International (macro) regions) • 100 km window/1km grids (National regions) • 10 km window/100m grids (Communes and urban districts) • 1 km window/10m grids (Urban neighbourhoods) • 100 m window/1m grids (Urban blocks and localities) EFGS conference 2015 Vienna
Reduce complexity – scope EFGS conference 2015 Vienna
In summary – the GEOSTAT Vision The goal: sustainable development Real user needs from government Spaceship Earth as a man-environmental system of systems to be described with appropriate scale and scope information An information system made of objects and structured according to the ecological method A point based foundation for statistics Concrete projects – GEOSTAT A network of Excellence – the EFGS EFGS conference 2015 Vienna
Everything is connected EFGS conference 2015 Vienna
Different monitoring levels • based on a core set of global indicators • harmonised to common global standards • predominantly taken from official data • applicable to all countries EFGS conference 2015 Vienna
The 3 tiers of SDG indicators Data revolution Targets not feasible to measure in the medium term Official Statistics enhanced ? Targets feasible to measure but requiring investments Targets can be measured now EFGS conference 2015 Vienna
The spatial dimension in the SDGs EFGS conference 2015 Vienna
From white to green to 10 pointsA European statistical-geospatial framework