Download
1 / 40
400 likes | 424 Views
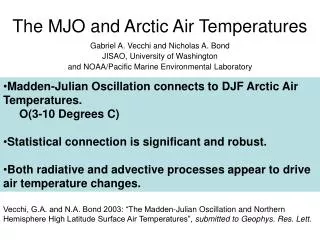
Statistical analysis reveals significant and robust connections between the Madden-Julian Oscillation and Arctic air temperatures. Radiative and advective processes drive temperature changes. Data analysis from various stations support findings.

E N D
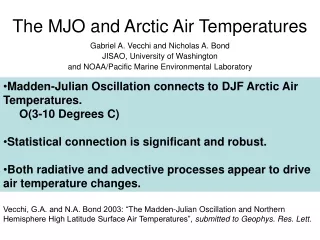
The MJO and Arctic Air Temperatures • Madden-Julian Oscillation connects to DJF Arctic Air Temperatures. • O(3-10 Degrees C) • Statistical connection is significant and robust. • Both radiative and advective processes appear to drive air temperature changes. Gabriel A. Vecchi and Nicholas A. Bond JISAO, University of Washington and NOAA/Pacific Marine Environmental Laboratory Vecchi, G.A. and N.A. Bond 2003: “The Madden-Julian Oscillation and Northern Hemisphere High Latitude Surface Air Temperatures”, submitted to Geophys. Res. Lett.
Introduction • MJO is dominant mode of large-scale tropical intraseasonal variability. • Connections have been found to precipitation along west coast of USA. e.g. Higgins and Mo 1997, Mo and Higgins 1998, Jones 2000, Bond and Vecchi 2003. • There are circulation anomalies in high-latitudes. e.g. Mo and Higgins 1998, Bond and Vecchi 2003.
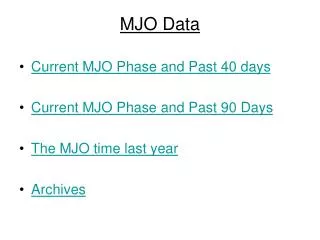
MJO Index • 850 hPa winds from NCEP/NCAR reanalysis (post-1979) • 1st and 2nd EOFs of Intraseasonal near-equatorial wind combined to generate MJO index (based on Shinoda et al. 1998, Bond and Vecchi 2003) • Divide MJO cycle into 8 Phases, based on angle of EOF1 and EOF2. Index available online at: http://ferret.pmel.noaa.gov/mjo
MJO composite Composite wintertime MJO 850 hPa zonal wind and OLR anomalies.
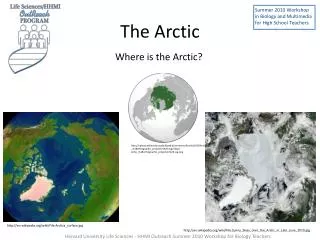
Arctic Air Temperature Data • Daily minimum temperature data from stations in Alaska, Canada and Keflavik, Iceland. (1979-2002) • Daily mean temperature data from stations in former U.S.S.R. (1979-1991) • Daily mean temperature data from station in Sermilik, Greenland (1979-2000).
Location of station data used in analysis
MJO and North American SAT • December-February Alaska, Canada, Sermilik (Greenland) and Keflavik (Iceland) data over 1979-2002. • Composite for each MJO Phase SAT Anomaly. • Estimate significance using Student’s-t test at 90%. • Also composite NCEP/NCAR extended reanalysis 500 hPa height and 700 hPa specific humidity anomalies.
Phase 5 Composite Circulation anomalies consistent with radiative and advective processes controlling SAT anomalies. Cool (Warm) SAT under low (high) 700 hPa humidity. Dry (cold) air over Alaska associated with flow from Siberia. Moist (warm) air in Canada associated with poleward flow.
MJO and Global Arctic SAT • December-February Alaska, Canada, Sermilik (Greenland), Keflavik (Iceland), and former USSR data over 1979-1990. • Composite for each MJO Phase SAT Anomaly. • Estimate significance using Student’s-t test at 90%. • Also composite NCEP/NCAR extended reanalysis 500 hPa height and 700 hPa specific humidity anomalies.
Phase 7 Global Composite Circulation anomalies consistent with radiative and advective processes controlling SAT anomalies.
Composites are robust (stationary) Over N. America composite is generally the same for periods 1979-2002, 1979-1990 and 1991-2002 Over USSR composites ~same for 6 year subperiods of 1979-1990 (not significant)
Summary • Madden-Julian Oscillation connects to Arctic Air Temperatures. • O(3-10 Degrees C) • Statistical connection is significant and robust. • Both radiative and advective processes appear to drive air temperature changes. • Association between MJO and Arctic SAT could be exploited for outlooks in 1-3 week timescale. Vecchi, G.A. and N.A. Bond 2003: “The Madden-Julian Oscillation and Northern Hemisphere High Latitude Surface Air Temperatures”, submitted to Geophys. Res. Lett. Contact: bond@pmel.noaa.gov or vecchi@atmos.washington.edu
Caveats • MJO definition used here is diagnostic, not prognostic…need to somehow forecast MJO. • Monitored real-time at CPC. • Extrapolations from current state being made by Matt Wheeler at Australia’s BOM. • Limited period of analysis: • 1979-2002 for North America • 1979-1990 for former USSR) • Period of analysis dominated by warm ENSO and positive PDO conditions
Future work…. • What mechanisms connect tropics to Arctic? • What is sensitivity of mechanisms and connections to background state? • Example of Arctic Oscillation:
AO Appears to impact character of MJO related signal Phase 2 Temp and Z500 Composites
Summary • Madden-Julian Oscillation connects to Arctic Air Temperatures. • O(3-10 Degrees C) • Statistical connection is significant and robust. • Both radiative and advective processes appear to drive air temperature changes. • Association between MJO and Arctic SAT could be exploited for outlooks in 1-3 week timescale. Vecchi, G.A. and N.A. Bond 2003: “The Madden-Julian Oscillation and Northern Hemisphere High Latitude Surface Air Temperatures”, submitted to Geophys. Res. Lett. Contact: bond@pmel.noaa.gov or vecchi@atmos.washington.edu