Download
1 / 40
400 likes | 430 Views
California's Gasoline Regulation program aims to reduce vehicle emissions by improving fuel quality, outlining limits on parameters like sulfur and benzene. The program has resulted in significant emission reductions and health benefits, making it a crucial component of the State Implementation Plan. However, challenges such as supply costs and production issues need to be addressed for its successful implementation and continued effectiveness.

E N D
2004 SIP Summit Gasoline and Vapor Recovery January 13-14, 2004
Motor Vehicle Fuels Control Strategy • Treat vehicles and fuels as a system • Vehicle emission standards • Fuel standards • Transport and marketing emissions • Flexible
Statewide ROG Emissions Trend CY 1995 (3500 tpd) CY 2010 (2000 tpd)
Statewide NOx Emissions Trend CY 1995 (4200 tpd) CY 2010 (2500 tpd)
2004 SIP Summit Gasoline January 13-14, 2004
Fuels Program Benefits Emissions Reduction Fuels Program HC NOx PM SOx Toxics percent Diesel 28 7 25 99 25 RFG 30 12 -- 95 45 tons/day Diesel + RFG 410 200 20 120 na
California Phase 2 Gasoline(CaRFG2) Program • Adopted in 1991 • Implemented March 1996 • Phase 2 RFG Predictive Model • Limits on the following parameters: Sulfur RVP (Summertime) T50 Benzene T90 Aromatic Hydrocarbons Olefins Oxygen Content
CaRFG2 Benefits • Emission reductions equivalent to removing 3.5 million vehicles from region’s roads • Reduces smog forming emissions from motor vehicles by 15% • Reduces benzene emissions by half • Reduces potential cancer risk from vehicle emissions by 40% • 1/4 of SIP reductions in 1996
CaRFG3 Regulations • Approved December 9, 1999 • Amended July 2002 • Implement the Governor’s Executive Orders • Removed MTBE from California gasoline 12/31/03 • Provide additional flexibility to remove MTBE and use ethanol • Ethanol is currently the only oxygenate approved for use in California gasoline • Gain additional emissions benefits over the California Phase 2 RFG program
Suggested Measures for Further Evaluation • SIP commitment includes examination of feasibility and scope of further gasoline specifications
Suggested Measures for Further Evaluation (cont.) • Sulfur 5 ppm • Oxygen 0 %wt.a • Aromatics 25 %vol. • Olefins 6 %vol. • T50 200° • T90 300° • RVP 6.4 b - 6.5 psi • Benzene 0.1% vol. aFederal CAA RFG areas must have at least 2% oxygen b U.S. EPA minimum
Comparison of Flat Limits a Federal CAA RFG areas to have at least 2% oxygen b RVP flat limit is 6.9 if CaRFG3 Predictive Model is used c U.S. EPA minimum 6.4
Estimated Potential Benefits • The estimated potential benefits associated with suggested measure in 2010: tons per day NOx 15 Hydrocarbons 35
Significant Issues • Costs • Supply
Costs Significant Issues (cont.) Capital cents per gallon $/lb. controlled Suggested Measure: 4 to 6 Billion dollars 10 - 20a 45 - 90b CaRFG2: 4 Billion 10 6.3b CaRFG3: 1 Billion 3 NAc a. Depends on costs of imports b. Only HC and NOx emissions reductions used to calculate cost effectiveness c. Intended to eliminate MTBE
Supply Significant Issues (cont.) • Production and Imports • Could further reduce in-state production by about 15% • Require more imports
Supply Significant Issues (cont.) • Availability of Imports • Limited due to specifications that are radically different from federal RFG for rest of the nation • Sulfur - 5 ppm cap vs 30 ppm average for federal RFG • Benzene - 0.1% by volume vs 1% by volume for federal RFG
Other Significant Issues (cont.) • Proposed 6.5 psi RFG limit makes production of complying fuel difficult if not impossible • Federal RVP minimum limit for fuel 6.4 psi • Leaves only 0.1 psi of flexibility • Reproducibility of test method is 0.2 psi
Other Significant Issues • Proposed 0% Oxygen Content • Federal CAA requires 2% oxygen content • Federal CAA oxygen requirement applies to 80% of all fuel sold in California • Would require a waiver of the federal oxygen requirement • Wintertime oxygen content requirement still in effect for the South Coast and parts of Imperial County
Conclusions • Significant supply and production issues to be addressed • Feasibility assessments require additional investigation • Potential for emissions benefits for gasoline
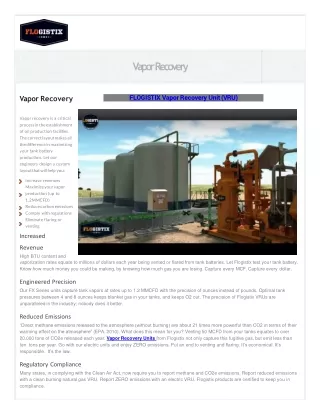
2004 SIP Summit Vapor Recovery January 13, 2004
Working to Solve a Mystery “there is much more unburned gasoline in the atmosphere than is indicated in the emission inventory.” Harley, Hannigan and Cass Environ. Sci. Tech. Vol.26, No. 12, 1992
Pipeline Refinery Marine loading Terminal Gasoline Pathways
Petroleum Marketing & Fuel StorageStatewide 2010 ROG Emissions 89 tons per day 25 TPD Portable Fuel Containers (gas cans) 18 TPD Cargo Tankers 8 TPD Refinery 6 TPD Terminals/ Bulk Plants 28 TPD Gasoline Dispensing Facilities (GDFs) 3 TPD Marine Loading 2 TPD Other
Vapor Recovery at GDFs Phase I Phase II
GDF Vapor Recovery Benefits • 347 TPD from vapor recovery • 25 TPD from Enhanced Vapor Recovery (EVR) • Total: 372 TPD
Gasoline Dispensing Facilities2010 ROG Emissions 28 tons per day 13 TPD Phase II 7 TPD Phase I 2 TPD Breathing 6 TPD Spillage
EVR for Aboveground Storage Tanks (ASTs) • EVR Phase I and Phase II emission reductions modest due to low throughput - less than 0.2 TPD • Breathing emissions - up to 7.4 TPD
Gasoline Dispensing at Marinas • Less than 0.2 TPD emission reductions as only about 0.10% of total state gasoline throughput dispensed at marinas
Gasoline Hose Permeation • Estimated baseline emissions: 3.0 TPD • Possible emission reductions: 1.7 TPD
Petroleum Marketing & Fuel StorageStatewide 2010 ROG Emissions 89 tons per day 25 TPD Portable Fuel Containers (gas cans) 18 TPD Cargo Tankers 8 TPD Refinery 6 TPD Terminals/ Bulk Plants 28 TPD Gasoline Dispensing Facilities 3 TPD Marine Loading 2 TPD Other
Portable Fuel Container (Gas Can)Regulation Emission Reductions 25 TPD Emissions Remaining 75 TPD Reductions
Petroleum Marketing & Fuel StorageStatewide 2010 ROG Emissions 89 tons per day 25 TPD Portable Fuel Containers (gas cans) 18 TPD Cargo Tankers 8 TPD Refinery 28 TPD Gasoline Dispensing Facilities 6 TPD Terminals/ Bulk Plants 3 TPD Marine Loading 2 TPD Other
Gasoline Cargo Tankers 2010 ROG Emissions18 TPD 4 TPD Working Losses 11 TPD Fugitives 3 TPD Hoses
Cargo Tanker Emission Points Vapor Vent Valve Vapor and Product Hoses
Gasoline Cargo Tankers • Estimated baseline emissions: 14 tons/day • Possible emission reductions: 11 tons/day
Petroleum Marketing & Fuel StorageStatewide 2010 ROG Emissions 89 tons per day 25 TPD Portable Fuel Containers (gas cans) 18 TPD Cargo Tanks 8 TPD Refinery 28 TPD Gasoline Dispensing Facilities 6 TPD Terminals/ Bulk Plants 3 TPD Marine Loading 2 TPD Other
Petroleum Marketing & Fuel StorageStatewide 2010 ROG Emissions 89 tons per day 25 TPD Portable Fuel Containers (gas cans) 18 TPD Cargo Tanks 8 TPD Refinery 28 TPD Gasoline Dispensing Facilities 6 TPD Terminals/ Bulk Plants 3 TPD Marine Loading 2 TPD Other
Other Possible Measures • Increase certification efficiency for gasoline transfer operations at terminals, bulk plants and GDFs • Increased electronic monitoring • Eliminate breathing losses by keeping gasoline vapor space at negative pressure • Reassess spillage standard based on EVR nozzles and new vehicles • Propane and LPG distribution